
Airbnb 3Q’26: Back in Growth Mode, but Agents Still Worry Me


When I sold Airbnb at $170s to buy more Meta at $650s couple of months ago, I admit I felt a little smart after watching Airbnb stock tumbling down while Meta skyrocketing to the Muse hype. I guess I should have known that the reality of public market investing is that “feeling smart” is usually a very fleeting experience. If I learn anything from my past decade of investing, it is that public market investors need to survive and thrive while feeling kinda dumb most of the time.
I have lots to say why I find personal agents still deeply concerning for Airbnb’s long-term future, but let me first go through the quarter.
Airbnb’s nights and seats (N&S) booked grew 16% YoY in 3Q’26, up from 10% in 2Q’26, while GBV grew 21% (FXN) and revenue grew 19% (16% FXN), all well ahead of the guide. Reserve Now, Pay Later (RNPL) added a net ~3 points to nights growth, so N&S still grew ~13% without it. RNPL bookings cancel more often (the cancellation rate went from ~16% to ~19%), and CFO said Q3 was the peak of the net benefit, so I see revenue as the cleaner signal of the underlying growth. FXN revenue growth went from 13% to 16%, and the Q4 guide of 16-18% revenue growth (including ~2 points of FX) suggests the momentum is holding even as the RNPL benefit fades.
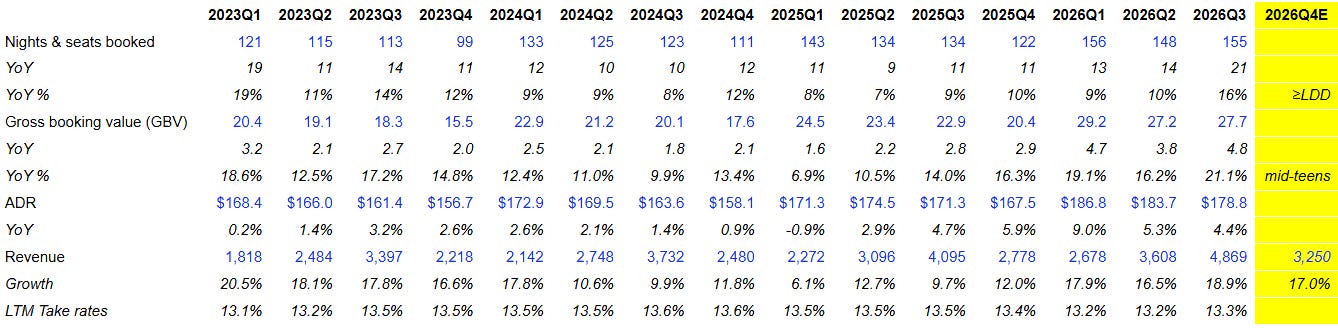
LTM take rate ticked up to 13.3% from 13.2% last quarter but remains below 13.5% a year ago, as RNPL records GBV at booking while revenue waits for check-in. Management expects the implied take rate to be up slightly YoY in Q4, helped by guest insurance revenue (up ~70%) and the single 15.5% host fee, which nearly all remaining hosts moved to in October.
North America was again the standout, with nights growing low double digits, the fastest in four years, and ADR up 6%. EMEA accelerated to mid-teens nights growth, and both LatAm and APAC grew more than 20%.


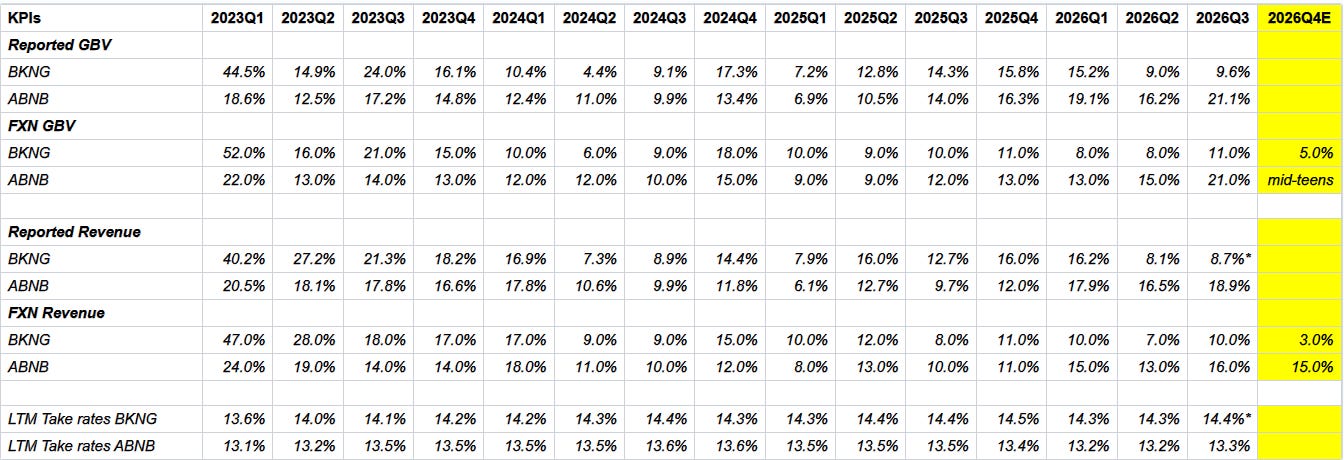
Airbnb’s FXN GBV grew 21% vs Booking’s 11%, a 1,000 bps gap after ~200 bps in 3Q’25 and 700 bps in 2Q’26. Booking’s own quarter improved, with room nights up 7% (vs 5% in Q2) and adjusted revenue up 9%. Its reported revenue fell 1% only because of a $900 million reduction for an FTC matter at Priceline, so I use adjusted revenue in the table below. The Q4 guides point to a similar gap, as Airbnb expects mid-teens GBV growth while Booking guided room nights up 1-3% and Expedia guided bookings up 3-5%.
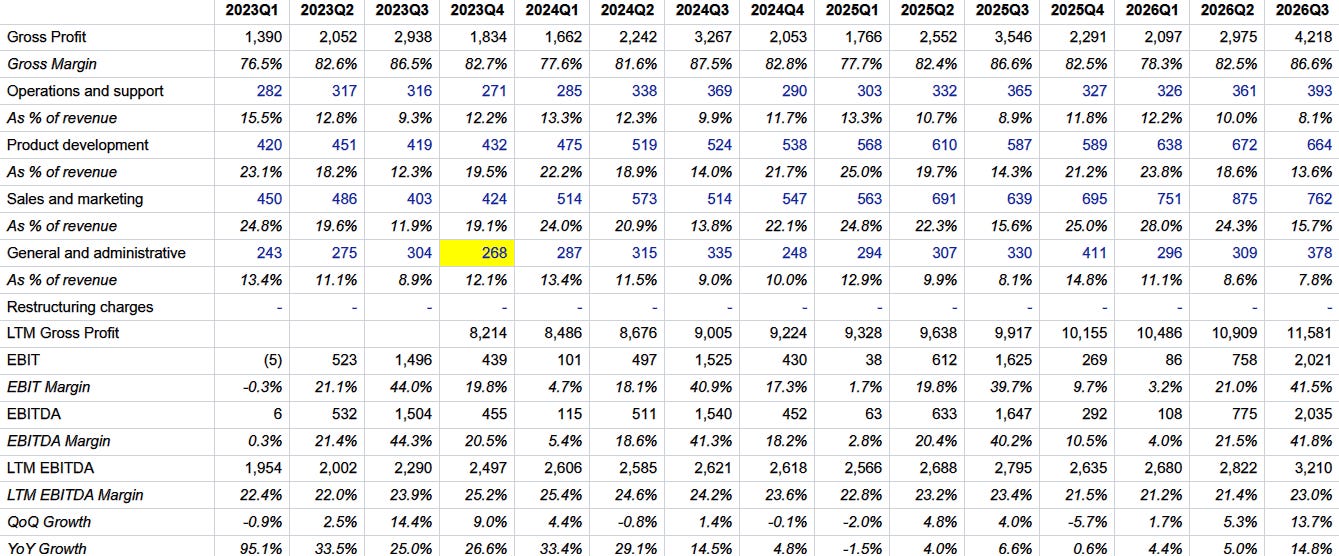
Without ignoring SBC, Airbnb’s EBITDA margin was 41.8%, up ~160 bps YoY, mostly thanks to operations and support, where the AI assistant now resolves ~40% of support issues without a human agent. LTM margin was 23.0% vs 23.4% a year ago, as it still carries the 4Q’25 investment quarter.
Last quarter I flagged that Airbnb’s GBV per advertising dollar had fallen YoY for two quarters. It was $59 vs $60 this quarter and 2.8x Booking’s $21, so the decline has mostly stopped. I would not close the question yet, since management said some marketing spend moved from Q3 into Q4, and brand and performance marketing is up ~30% year to date against ~19% GBV growth. Booking’s marketing grew 11% against 10% gross bookings growth.
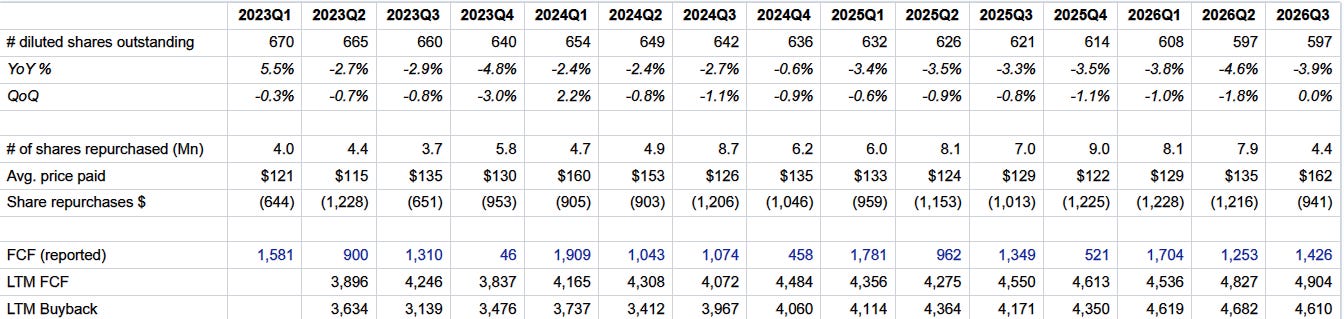
Airbnb repurchased $712 million of stock at ~$162 per share. Including taxes paid on employee equity awards, LTM buybacks were $4.6 Billion against $4.9 Billion of LTM FCF, and the diluted share count fell 3.9% YoY. FCF grew only 6% despite 19% revenue growth, which is the other side of RNPL, as guests now pay closer to the stay.
Overall, this was as good a quarter as Airbnb has had in a while, and the near-term picture looks better than it did a few quarters ago. The question that is, however, of paramount importance for shareholders is what happens over the next 5 to 10 years. Brian Chesky spent much of the call explaining why he doesn’t think consumer agents such as Muse or Instinct are a big threat. Below, I go through his two main arguments and why I am not quite convinced yet, using what Muse built when I asked it to plan a trip for my family, with screenshots and the prices it found for the same houses on Airbnb, Vrbo, Booking.com and the property managers’ own sites.
Subscribers get the daily journal and five+ years of Deep Dives, i.e. full-length analyses with financial models on 70+ companies. The daily is just how I think out loud between the Deep Dives!