
How Market Position Shapes Credit Card Interest Rates


Kyle Herkenhoff and Juan M. Morelli

Why is it that two borrowers who look much alike can be offered very different rates when applying for a credit card? In a recent paper, we address this question by examining how the rate offered changes when the lender’s funding cost falls. Data on 14 million newly issued cards show that when a lender’s funding costs decline, the lender passes less of that decline on to the offer rate when it holds a large market share. That is, two borrowers with similar credit scores and incomes borrowing from the same lender can see noticeably different interest rates on the credit card they are applying for.
Credit Card Lenders Serve Many Different Markets
Credit card lenders do not compete in a single, undifferentiated national market. They target offers and design products for particular types of borrowers. Industry reports, regulatory guidance, and academic research document segmentation by credit risk, income, card characteristics, and acquisition channel. A prime borrower applying online for a general-purpose, non-co-branded card belongs to a different market than a subprime borrower accepting a preapproved offer for a general-purpose, co-branded card. The same lender can have a large share in one of these markets and a small share in another.
Guided by these documented practices, we define 960 nationwide markets by combining four credit-score groups, card and product type, acquisition channel, and income groups based on the borrower’s ZIP code. In our data, lenders operate in about 200 of these markets on average in a given week. Within each market, we define a lender’s share as its revenue relative to total revenue in that market.
Rates Track Lenders’ Market Position
We begin by asking whether the rates borrowers receive are related to their lender’s share of the market. To do so, we use confidential account-level data collected by the Office of the Comptroller of the Currency (OCC). The data report annual percentage rates (APRs) and detailed borrower and card characteristics for newly issued accounts. We form groups of accounts finely matched on observed borrower and product characteristics, such as income, credit score, and credit card type, so that the accounts within any group look much alike.
The chart below plots the average APR in each group (vertical axis) against the average market share of the lenders issuing those cards (horizontal axis). The relation is clearly positive, with a correlation of 54 percent: higher lender market shares are associated with higher APRs. In the companion paper, we show this is not driven by differences in characteristics across borrowers (for example, default risk) or across banks (for example, lending costs); market shares remain strongly related to rates once those characteristics are accounted for.
Credit Card Rates Are Tied to a Lenders’ Market Share
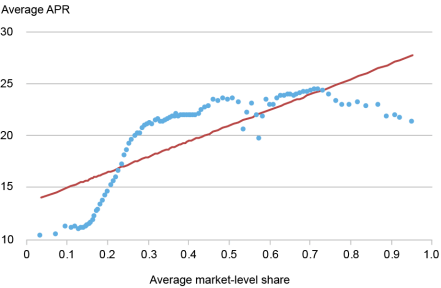
Notes: Each point is a group of accounts matched on income, credit score, card type, and other borrower and product characteristics. The vertical axis is the group’s average APR; the horizontal axis is the average market share of the lenders issuing those cards.
Group averages, though, can still differ for reasons other than market positions. For instance, groups vary in default risk, and riskier borrowers pay a higher APR. For that reason, in the companion paper we examine differences in APRs within each group, where credit score, income, and credit card type are held fixed by construction, so differences in rates within a group cannot be attributed to them. We find that, even among borrowers and cards that look very similar in the data, differences in APRs are larger when differences in lenders’ market positions are larger.
While these patterns are suggestive, they remain descriptive. Lenders may hold large shares in markets that differ in ways we do not observe, and those differences could also affect APRs. We therefore turn to a more direct test of lender conduct.
What Happens When Lenders’ Funding Costs Fall?
Most variable-rate credit card accounts are tied to a contractual benchmark after they are issued, so changes in APRs on existing accounts are partly mechanical. We instead study accounts at origination, when the lender chooses the initial APR, including its spread over that benchmark.
Our baseline analysis focuses on January 2008 since it had one of the largest unanticipated movements in the federal funds rate. For additional events through 2019, we supplement this data with comparable information collected by the Federal Reserve. Together, the two datasets cover roughly 14 million newly issued accounts and report their origination dates, APRs, and detailed borrower and card characteristics.
When an unexpected change in the risk-free rate moves lenders’ cost of funds, we compare accounts issued shortly before and shortly after the change. We strip out APR changes common to all of a lender’s markets and adjust for observed differences in borrowers and products, including credit score, income, and card type. What remains is a comparison of the same lender, around the same unexpected change in the risk-free rate, across markets where its share differs. We refer to the resulting measure as the adjusted APR.
Consider a lender that has a large share in one market but a small share in another, and suppose the risk-free rate declines by 25 basis points. If the lender passed the decline through fully in both markets, APRs on newly issued accounts would fall by 25 basis points in each. Instead, suppose it cuts APRs by 15 basis points in the high-share market and by 20 basis points in the low-share market. The difference between these responses measures how much less of the decline is passed through where the lender has a larger share.
Lenders Pass Through Less Where Their Shares Are Larger
Our clearest evidence comes from January 2008, when the federal funds rate fell unexpectedly by 25 basis points. We compare how the same lender adjusts its rates in its high-share markets versus its low-share markets, in the weeks right around the unexpected fed funds rate change. The vertical axis in the chart below shows the difference in the percentage change in adjusted APRs between markets where a lender has a large share—defined as being in the top 30 percent of the distribution of market shares—and that same lender’s lower-share markets. A negative value is evidence that adjusted APRs fall by a larger percentage in the lender’s lower-share markets than in its high-share markets. The horizontal axis shows the number of weeks (denoted h) before or after the unanticipated fed funds rate movement, with the vertical dotted line being the week of the event. So, h=-1 considers cards issued one week before the event, while a point at week h=1 considers cards issued one week after the event.
Credit Card Lenders Pass Through Less in Markets Where Their Shares Are Larger
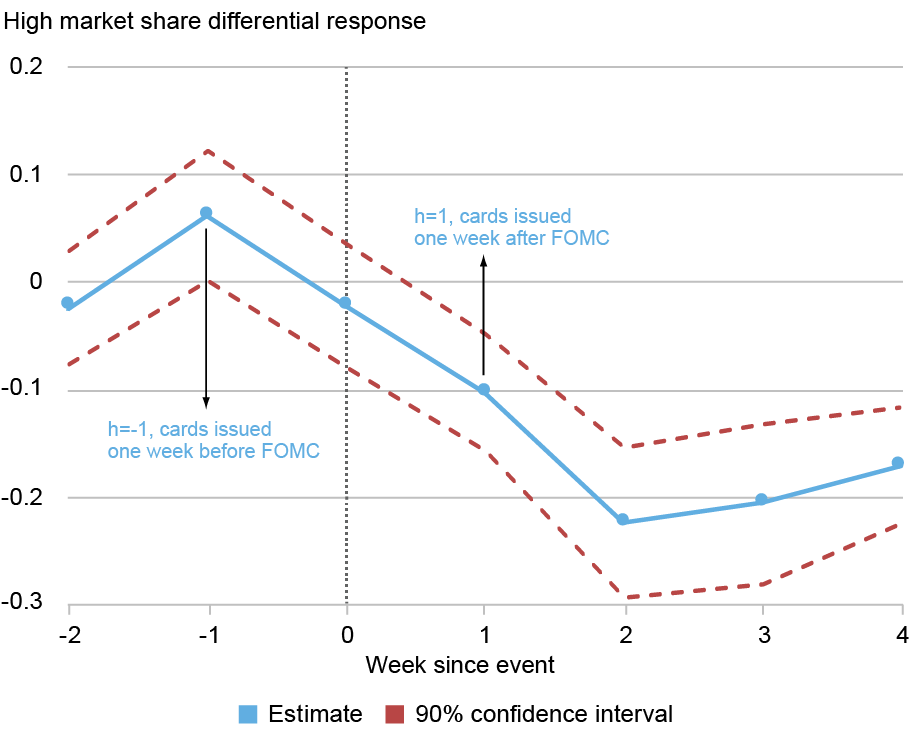
Notes: The chart shows the differential response of adjusted APRs on newly issued cards in a lender’s high-share markets relative to its lower-share markets. Negative values indicate that APRs fall less in high-share markets. The vertical line marks the unexpected change in the risk-free rate. FOMC is Federal Open Market Committee.
The chart shows that at two weeks after the Federal Open Market Committee event, the pass-through is 20 percent lower in high-share markets than in low-share markets served by the same lender. To put that in perspective, for an average adjusted APR of 10 percent, the lender would cut the borrowing rate by 2 percentage points less if it has a high share than if it has a low share, per 1 percentage point change in the risk-free rate.
Put differently, among borrowers with similar observed characteristics taking out similar cards from the same lender, those in high-share markets have less of the decline in funding costs passed through to the APR they are offered. The result is not unique to January 2008. It remains sizable when we combine the large unexpected changes in the risk-free rate over the rest of 2008. When we include all qualifying increases and decreases from 2008 through 2019, the estimate is smaller but remains statistically significant.
Taking Stock
High credit card rates, concentration, and rate dispersion may be consistent with market power, but none alone reveals how lenders set prices. We instead compare how the same lender adjusts APRs across its own markets after a change in its funding costs. We find that lenders pass through less where their market shares are larger, a pattern that appears across events and borrower groups. Borrowers with similar observed characteristics can therefore receive different APRs from the same nationwide lender depending on that lender’s share in their particular market.
Kyle Herkenhoff is a consultant at the Federal Reserve Bank of Minneapolis and an associate professor of economics at the University of Minnesota.
Juan M. Morelli is a research economist in the Federal Reserve Bank of New York’s Research and Statistics Group.
How to cite this post:
Kyle Herkenhoff and Juan M. Morelli, “How Market Position Shapes Credit Card Interest Rates,” Federal Reserve Bank of New York Liberty Street Economics, November 4, 2026, https://doi.org/10.59576/lse.20261104 BibTeX: |
@article{KyleHerkenhoffandJuanM.Morelli2026,
    author={Kyle Herkenhoff and Juan M. Morelli},
    title={How Market Position Shapes Credit Card Interest Rates},
    journal={Liberty Street Economics},
    note={Liberty Street Economics Blog},
    number={November 4},
    year={2026},
    url={https://doi.org/10.59576/lse.20261104}
}
You may also be interested in:

Has Broader Stock Market Participation Changed How Interest Rates Affect the Economy?

Why Are Credit Card Rates So High?
Disclaimer
The views expressed in this post are those of the author(s) and do not necessarily reflect the position of the Federal Reserve Bank of New York or the Federal Reserve System. Any errors or omissions are the responsibility of the author(s).