Forecasting space weather risks on power grids


At a glance
- End-to-end forecasting: A machine learning pipeline uses forecast-time solar-wind information to generate location-specific risk estimates for 66,935 substations in the continental United States.
- Physics and place: The system combines Auroral Electrojet (AE) and Disturbance Storm Time (Dst) forecasts with local latitude, geology, and ground conductivity.
- Advance warning: The pipeline detected nearly 80% of major space-weather events during the evaluation period and can warn grid operators 30 to 60 minutes before a specific risk appears.
Forecasting a threat to critical infrastructure
During the May 2024 geomagnetic storm, utilities across North America prepared for possible impacts as auroras extended far beyond their usual range. The storm would degrade GPS accuracy and satellite operations, impacting farm operations in North America and Europe. Modern society depends on reliable electric power, yet extreme space-weather events can induce currents in transmission networks that damage equipment and increase operational risk. The challenge is not only knowing that a storm is approaching, but estimating when and where its effects could be most severe with enough warning for grid operators to respond.
During my summer internship at Microsoft Research, I developed a machine learning system that forecasts space-weather risk across 66,935 substations in the continental United States. The system measures how the sun’s activity can affect the earth’s magnetic field and, ultimately, the power grid. It combines solar-wind observations, forecasts of the Auroral Electrojet (AE) and Disturbance Storm Time (Dst) indices, physics-informed constraints, local geological conductivity, and grid-infrastructure data to produce location-specific risk estimates 30-60 minutes ahead of potential impact.
Building an end-to-end prediction pipeline
Space-weather prediction is difficult because it spans several coupled systems. The solar wind changes rapidly, its interaction with Earth’s magnetosphere is irregular, and the resulting ground effects depend on local conditions. Regions with resistive bedrock can experience stronger geomagnetically induced currents (GICs) than regions with more conductive geology. Transmission-line orientation, latitude, and other power-system characteristics further influence the exposure of individual assets.
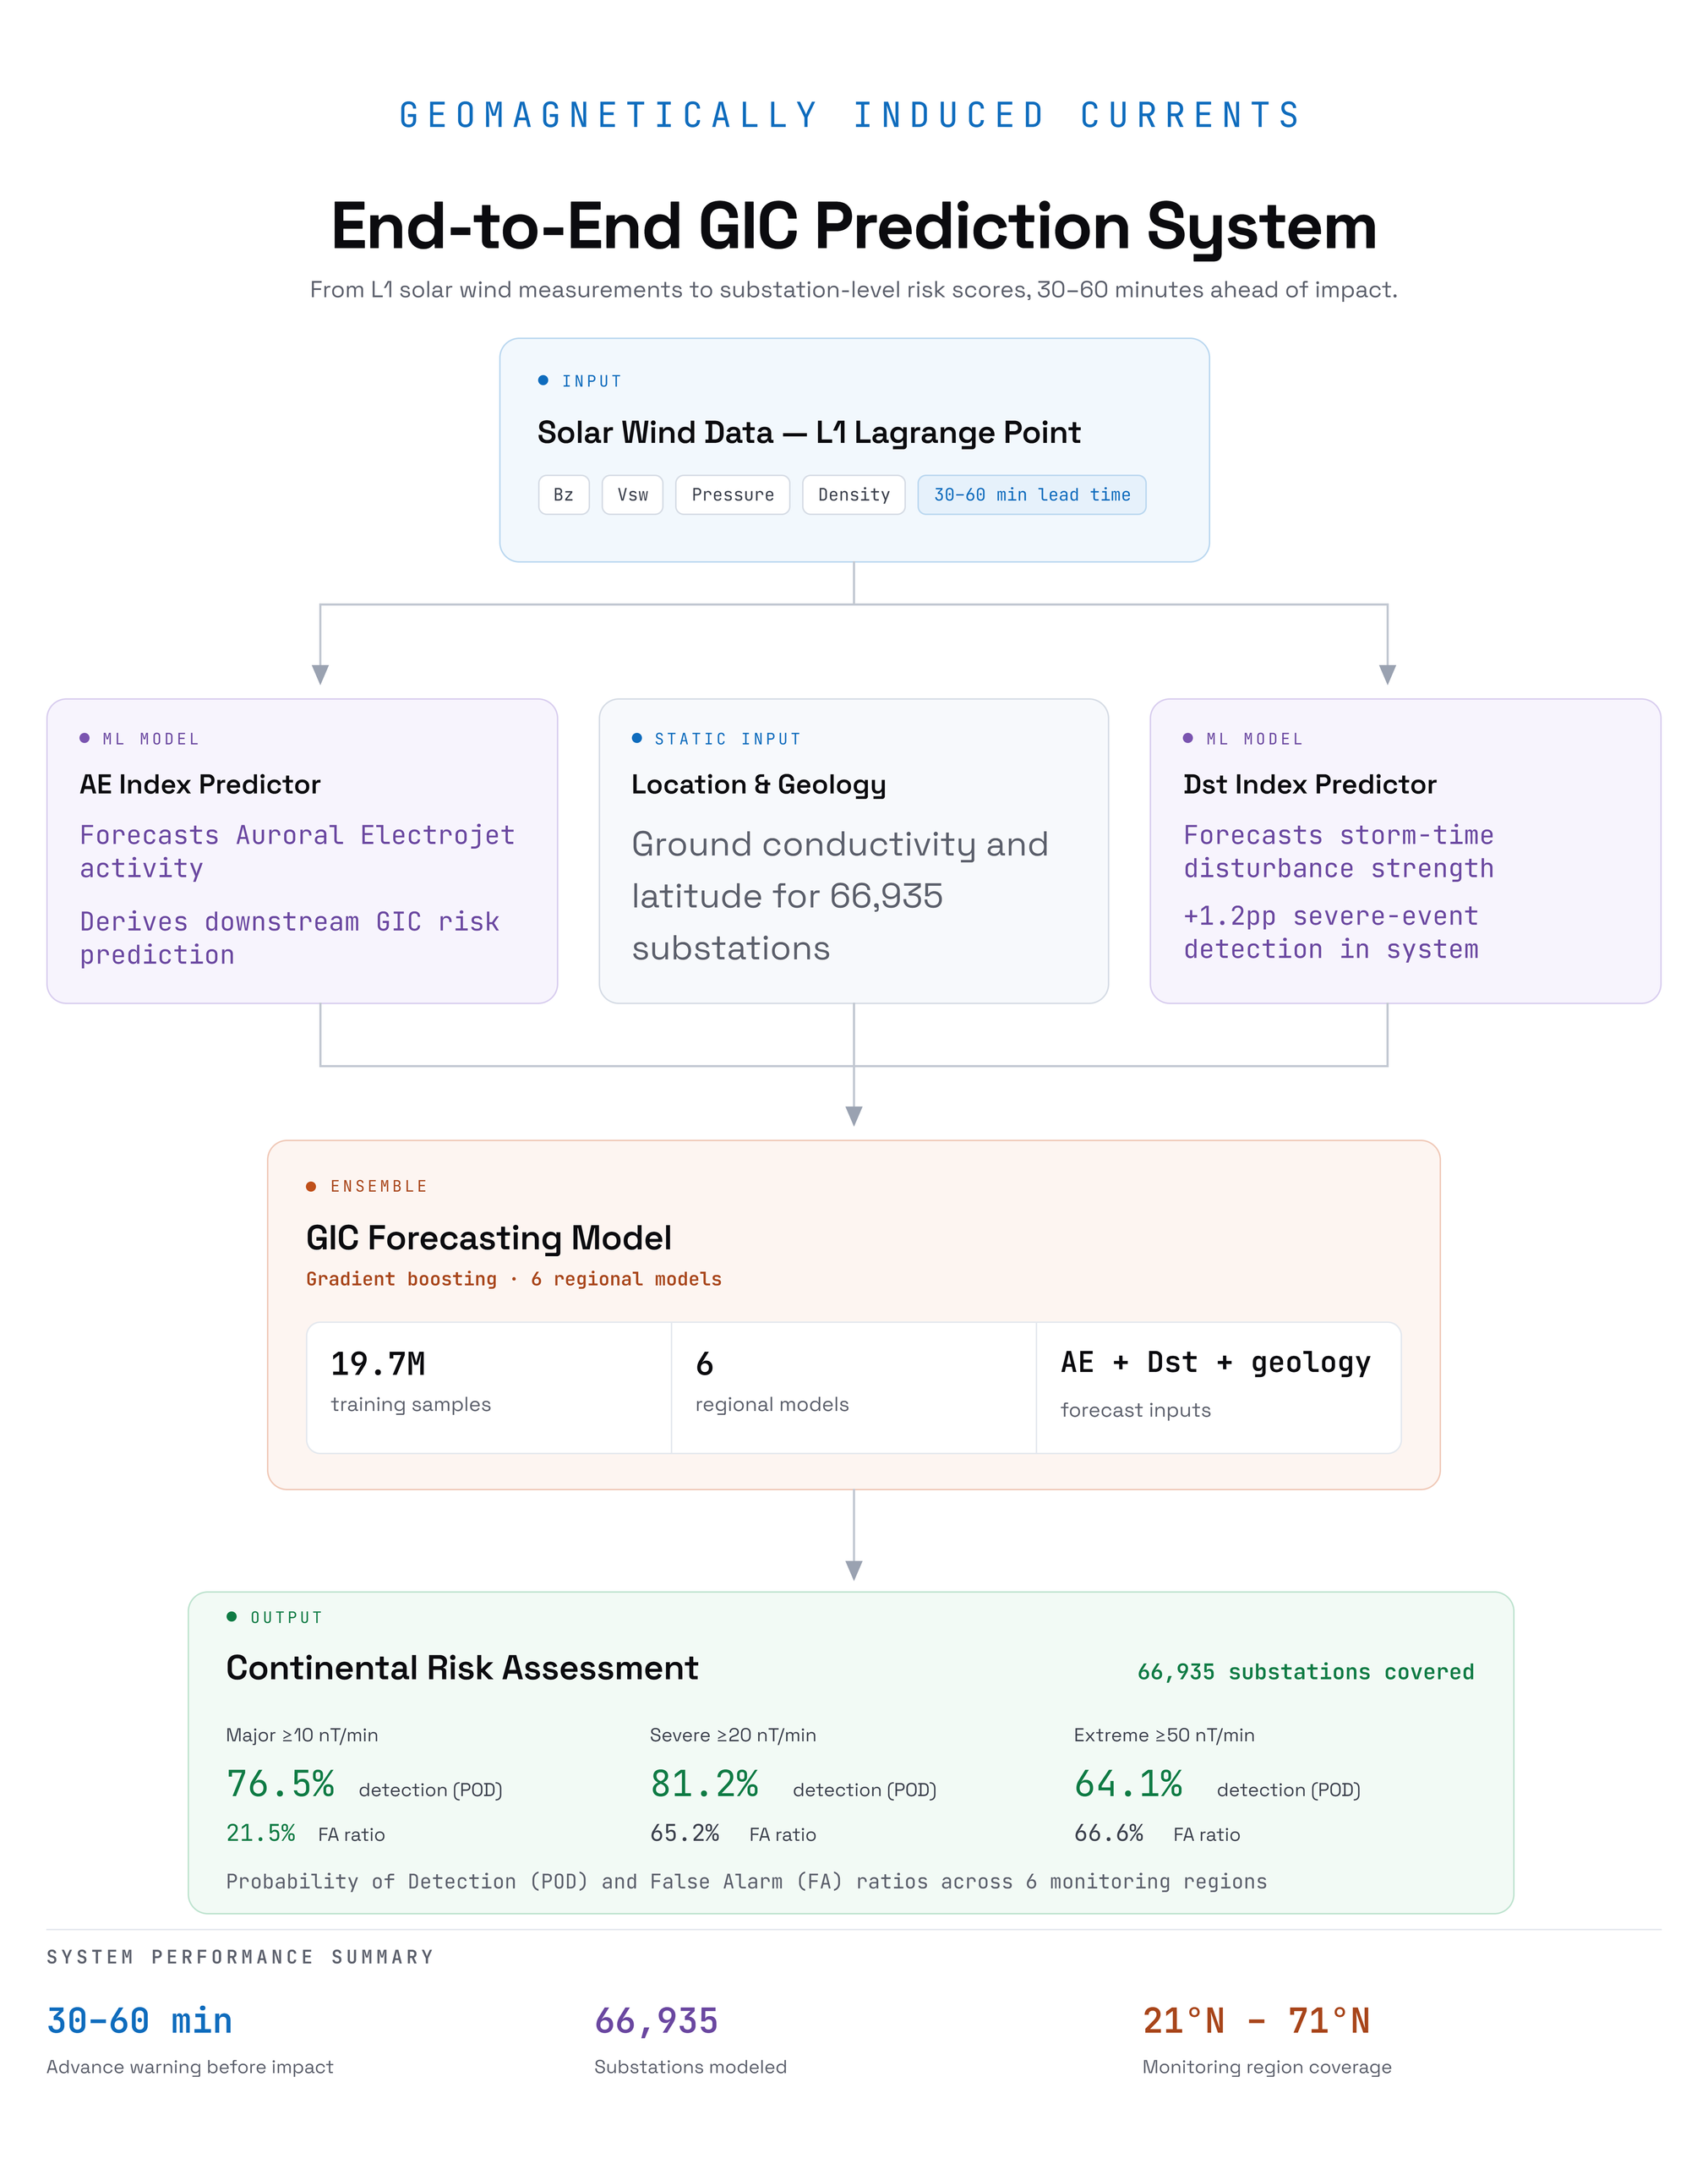
The pipeline addresses this complexity in three stages, shown in Figure 1. First, solar-wind measurements from the L1 Lagrange point are used to generate forecasts of the AE and Dst indices, while geological conductivity and location features are assembled for each substation. Second, a gradient-boosting model combines these forecasted and location-specific inputs to estimate dB/dt, the rate of magnetic-field change associated with GIC risk. Finally, the resulting predictions are converted into location-specific risk estimates and aggregated into a continental risk assessment. A system of 50 AI agents helped explore features, validation strategies, and model configurations across the pipeline. Only public data sources were used, included NASA OMNI and NASA-aggregated Kyoto World Data Center data, INTERMAGNET and U.S. Geological Survey magnetometer observations, and GridSFM-derived grid data.
Evaluating geomagnetic forecasts and infrastructure risk
The AE predictor was designed to forecast rare, high-intensity geomagnetic activity that drives infrastructure risk. In the 2020-2026 evaluation period, the model produced forecasts spanning nearly the full observed range of AE activity and outperformed several empirical solar-wind-based approaches. The Dst predictor provided an additional signal describing large-scale geomagnetic storm strength. During the most geomagnetically active periods of the 2020-2026 evaluation period, the machine-learning model outperformed the Burton equation on 62.2% of individual hours. The model also produced a substantially wider prediction range than Burton-style approaches and improved severe-event detection in the end-to-end forecasting system by 1.2 percentage points when combined with AE forecasts.
The GIC risk stage was evaluated differently. There is no equivalent widely deployed operational system that provides a direct industry benchmark for this calculation, so the machine learning model was compared with simple linear regression. As Figure 2 shows, the system achieved detection rates of 76.5% for major events (≥10 nT/min), 81.2% for severe events (≥20 nT/min), and 64.1% for extreme events (≥50 nT/min). False-alarm rates increased with storm severity, reflecting the trade-off between missed events and cautious alerts. Performance varied by latitude, with the highest detection rates at northern stations where geomagnetic activity is strongest.

Translating predictions into continental risk assessments
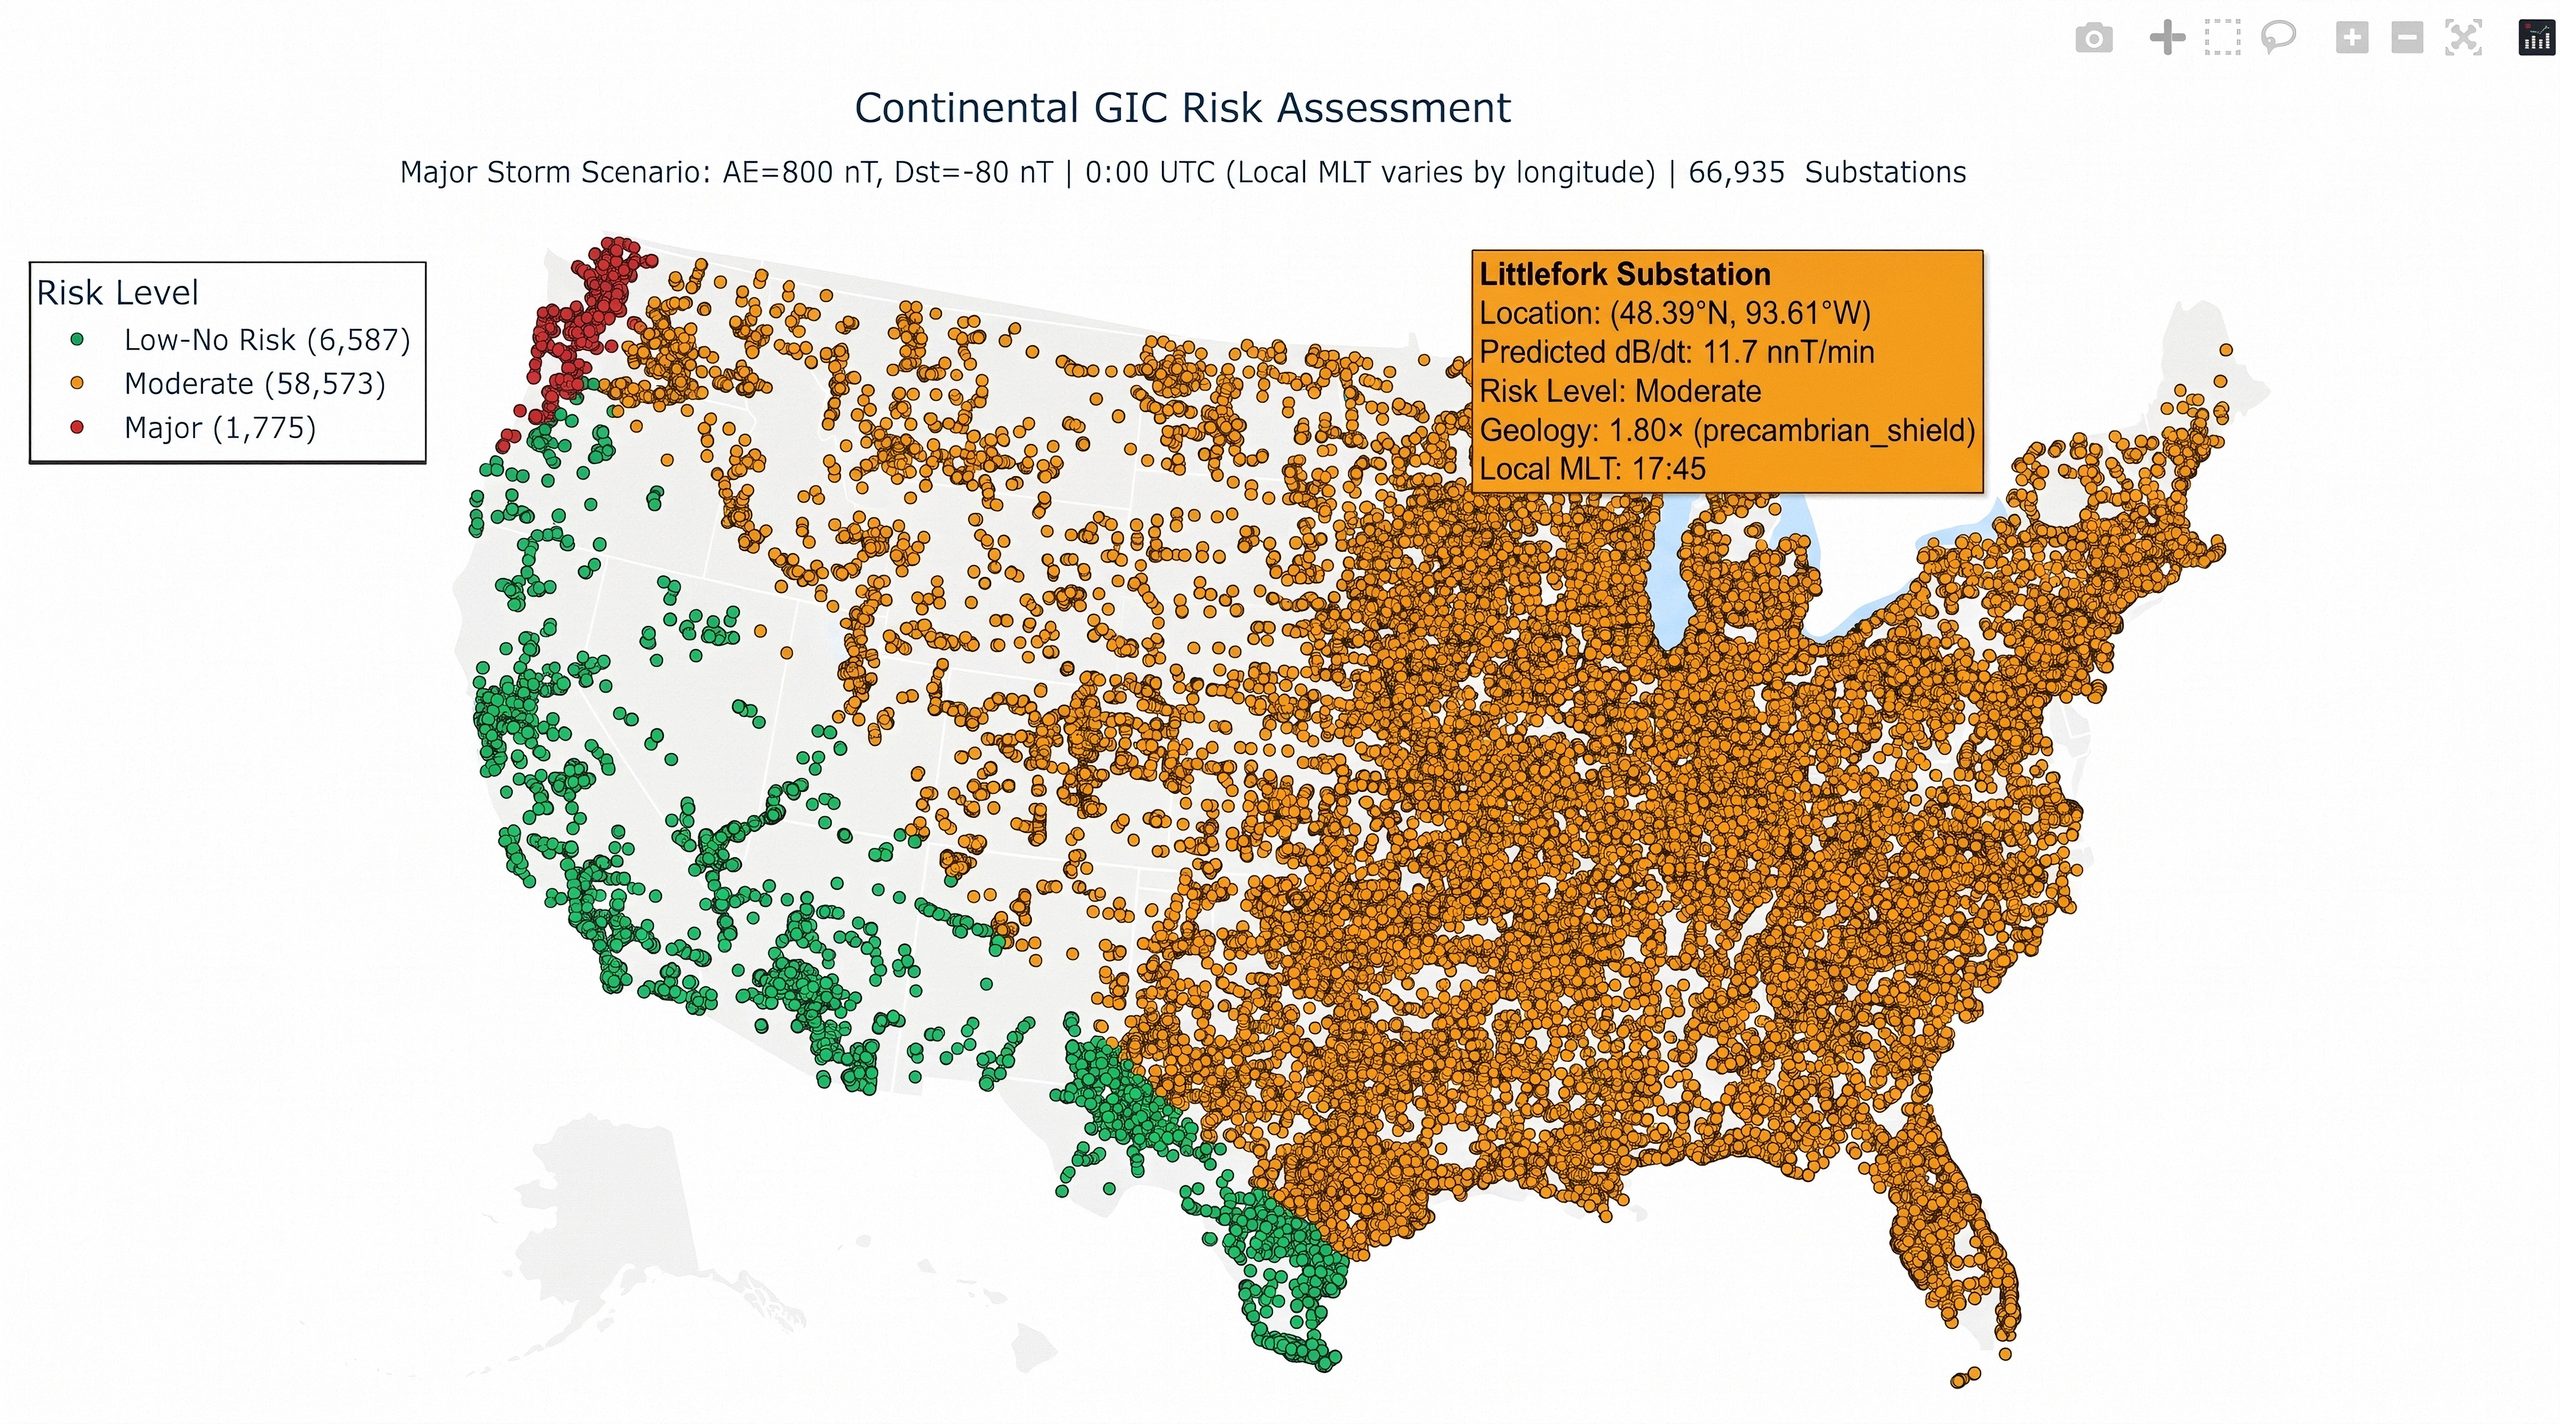
The final stage translates predicted geomagnetic activity into location-specific estimates of dB/dt, the rate of magnetic-field change associated with GIC exposure. Rather than issuing a single alert for the continental United States, the system combines storm conditions with each substation’s latitude and geological factor. This produces continuous risk estimates that can distinguish lower-risk locations from areas where resistive geology can amplify ground-level effects.
Figure 3 illustrates the output for a representative major-storm scenario. The map is a demonstration of the model’s continental-scale output, not a record of a live operational event. It shows how a grid operator or planner could move from a broad space-weather warning toward a more targeted view of which locations may warrant closer analysis. The current pipeline produced estimates for all 66,935 substations in approximately 333 milliseconds during measured inference, allowing many scenarios to be evaluated quickly.
Implications and looking forward
This work demonstrates how physics-grounded machine learning could support more specific and timely assessment of space-weather exposure. Earlier, location-specific information could help utilities prioritize engineering review and consider targeted protective actions, such as adjusting reactive-power reserves or temporarily reconfiguring parts of the network. Further validation with utilities and operational data would be needed before the system could be used in grid operations.
The project also connects with broader Microsoft Research work on AI for power systems. The open grid-data pipeline provided realistic U.S. transmission models, while GridSFM applies deep learning to AC optimal power flow for fast scenario analysis. Together, these efforts point toward richer planning and resilience workflows that combine hazard forecasts, grid topology, and power-flow analysis.
- Extend forecast horizons: Explore temporal-transformer approaches that capture longer-range patterns in solar-wind data and move beyond the current 30-60-minute window.
- Scale internationally: Adapt the system to additional regions while accounting for different geological conditions and grid topologies.
- Integrate with grid operations: Evaluate how forecasts could support existing decision-making and engineering-review workflows before considering higher levels of automation.
- Provide transformer-level risk: Add asset-specific characteristics to move from substation-level estimates toward more granular assessments of critical equipment.
Related Microsoft Research work
GridSFM: A new, small foundation model for the electric gridBuilding realistic electric transmission grid dataset at scale: a pipeline from open dataset
Acknowledgements
Special thanks to my mentors Weiwei Yang and Spencer Fowers for their guidance throughout this project, and to Amber Hoak, Weishung Liu, and Andrea Britto for their editorial and technical feedback.
Opens in a new tab
The post appeared first on Microsoft Research.

 点赞
点赞 收藏
收藏 点踩
点踩 分享
分享