Edge AI Inference for Manufacturing

Summary
Run vision inference at the edge in manufacturing because the line imposes three constraints the cloud can't meet: a reject decision with a millisecond deadline, a camera producing about 1.49 Gbit/s of raw video per stream, and a WAN that will eventually go down. Train in the cloud, export a small model like RF-DETR Nano, run it locally with Roboflow Inference, hand the result to the PLC as tags over OPC UA, Modbus TCP, or EtherNet/IP, and manage the fleet with Deployment Manager.
A vision AI system on a production line has a different job from a typical cloud AI application. It may have only a fraction of a second to inspect a part, decide whether it passes, and send that result to a PLC before the product reaches the next station. That makes where inference runs just as important as the model itself.
Running computer vision at the edge keeps this decision path close to the camera and production equipment. Images can be processed locally for defect inspection, assembly checks, OCR, counting, or safety monitoring, while cloud infrastructure is reserved for tasks such as training, analytics, and managing deployments across sites.
This guide explains how to build that architecture at manufacturing scale, including hardware selection, model optimization, local deployment, PLC and MES integration, fleet management, and the IT/OT controls needed for enterprise environments.
What Is Edge AI Inference in Manufacturing?
Edge AI inference means running a trained computer vision model on hardware located at or near the production line instead of sending every image or video frame to a remote cloud server.
The important distinction is between training and inference. Training is where a model learns from a labeled dataset and usually benefits from cloud GPUs and scalable compute. Inference is what happens after training. A camera captures a new image, the trained model analyzes it, and the system returns a prediction such as defect, missing_part, count = 24, or reject_signal = true.
Roboflow supports both approaches. A model can be trained in the cloud and then deployed on the plant floor using Roboflow Inference. Complete applications built with Roboflow Workflows can also run locally on NVIDIA Jetson, GPU-equipped computers, Raspberry Pi, and other supported systems.
A typical manufacturing architecture looks like this:
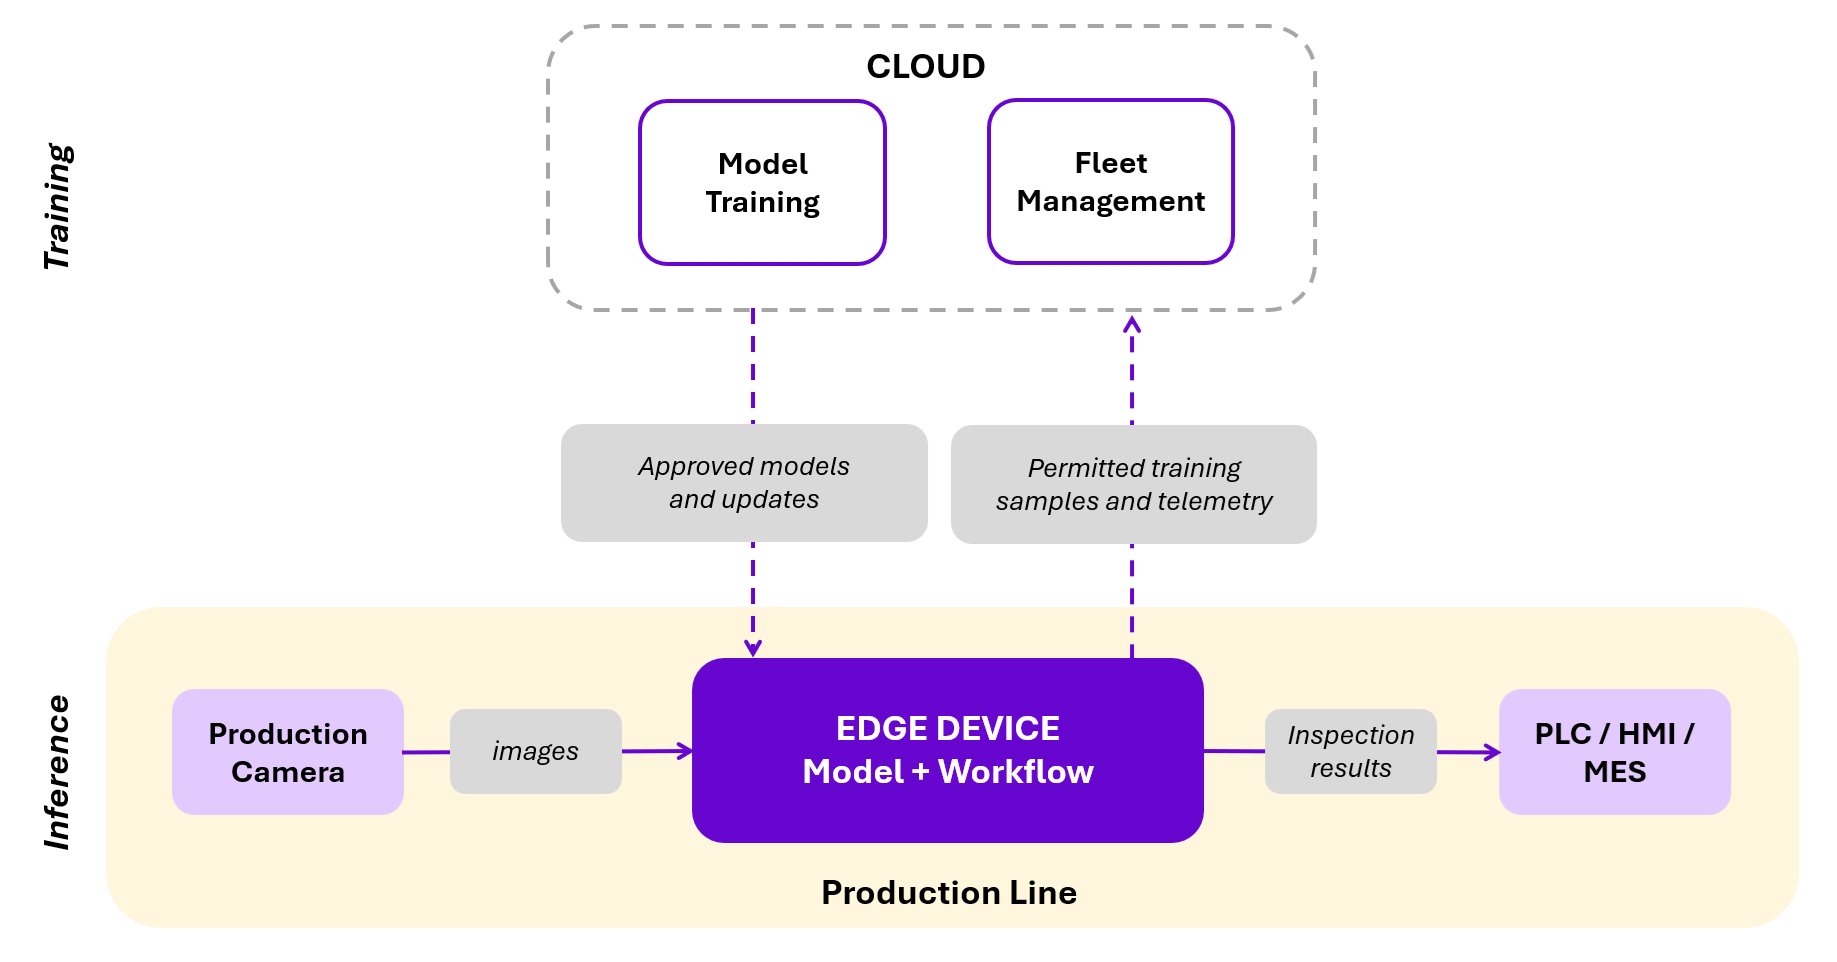
The critical production path stays local:

Cloud connectivity can still support model training, configuration, fleet management, telemetry, and selected production events without becoming part of the real-time decision path.
Keeping the processing data closer to industrial equipment can reduce communication delays, lower bandwidth requirements, and decrease dependence on remote infrastructure. These advantages are especially important for latency-sensitive tasks such as fault detection, quality inspection, and automated production decisions.
Why Manufacturers Run Inference at the Edge
The main reason to run vision inference at the edge is that manufacturing decisions often have a physical deadline.
Latency becomes part of the machine cycle
A cloud inference request has to encode or upload an image, traverse the plant network and WAN, reach a remote server, wait for processing, return the result, and then hand that result back to the control system.
It is estimated that a standard cloud round trip takes 100-300 ms. Local edge systems remove that network hop. Roboflow AI1, for example, is designed around a sub-100 ms local vision-to-result path for production applications.
On a conveyor, 100 ms can be significant. Suppose a component moves at 1 m/s and the camera sits 200 mm upstream from a reject mechanism. That gives roughly 200 ms before the part reaches the rejector, and the decision has to arrive early enough for the actuator to fire, so the usable budget is smaller still. Within that window the system has to capture the image, run inference, apply inspection logic, communicate the result, and let the PLC schedule the reject. A 100-300 ms WAN round trip can consume all of it before model inference or control logic is considered.
This is why reject decisions, robot guidance, interlocks, and other time-sensitive actions are usually better placed at the edge.
Camera bandwidth scales quickly
A 1920 × 1080 RGB frame contains 2,073,600 pixels. With three 8-bit color channels, that is 24 bits per pixel, or about 6.2 MB of uncompressed pixel data per frame. At 30 FPS, the raw data rate works out to
1920 × 1080 × 3 × 8 × 30 ≈ 1.49 Gbit/sper camera. Machine vision cameras normally stream uncompressed over GigE Vision, USB3 Vision, or CoaXPress, so that figure is not a theoretical maximum. It is what the network actually carries. A Gigabit Ethernet connection provides 125 MB/s, and that has to cover image data, control data, and packet resends, so a single 1080p color stream at 30 FPS already exceeds it.
Compression is the usual answer for video that has to travel. A 1920 × 1080 H.264 stream at 30 FPS and high quality is estimated at about 4 Mbps, falling to 2.8 Mbps at medium quality and 2 Mbps at low quality. That is a reduction of several hundred to one, and inspection models are asked to find scratches, hairline cracks, and color drift, which are the details a lossy encoder discards first.
Running inference next to the camera avoids the choice. Full-resolution frames stay on the plant floor, and what moves upstream is a result per part rather than a continuous video stream.
A WAN outage does not stop the line
A cloud-only inspection system depends on network availability. An edge system can keep executing the model even when the plant WAN is unavailable.
For Roboflow Enterprise deployments, Offline Mode caches model weights locally for up to 30 days. Predictions then run from that cache without sending production images to Roboflow. Each inference response carries an expiration value showing how many days of the lease remain, and once that drops below seven the Inference Server retries hourly until it reaches the Roboflow API, which resets the counter to 30. A line with intermittent connectivity therefore rides through outages without interruption, and only a site that never reconnects loses inference when the lease finally expires.
There is an important architectural distinction here. Standalone self-hosted Inference can support offline operation, whereas devices managed continuously through Deployment Manager need connectivity to Roboflow for remote management and monitoring.
Where Edge Inference Pays Off on the Floor
The most useful manufacturing applications are the ones where a visual observation needs to become a decision immediately. Here are few examples:
- Inline defect detection. A camera can identify scratches, cracks, inclusions, PCB faults, or weld defects before a part moves to the next process. See the surface defect detection tutorial, PCB defect detection tutorial, and weld inspection example.
- Assembly verification. Vision AI can confirm that required components are present, correctly positioned, and assembled in the expected order before the unit leaves the station. See Visual Assembly Verification with Computer Vision.
- Label and OCR compliance. OCR can verify lot numbers, dates, product text, package labels, and other printed information while the product is still on the line. See How to Use OCR in Manufacturing.
- Machine guarding and worker safety. Computer vision can monitor restricted zones, PPE, and worker proximity to equipment and generate local alerts without streaming continuous video to the cloud. See the machine guarding guide and PPE detection tutorial.
- Pick-and-pack counting. Object detection can count bottles, fasteners, packages, or kit components and immediately flag underfilled or overfilled packs. See Package Counting and Inspection with Computer Vision and conveyor counting.
Edge vs Cloud vs Hybrid
For manufacturing, edge and cloud are not competing choices. The right deployment depends on what each workload needs to accomplish and how quickly it must respond. Time-critical actions belong close to the production line, while compute-intensive or plant-wide tasks can run elsewhere.
The table below shows a practical way to divide common manufacturing vision workloads between the edge, plant network, and cloud based on latency, availability, data movement, and compute requirements.
| Workload | Recommended placement | Reason |
|---|---|---|
| Per-part inspection and reject decision | Edge | Keeps the decision close to the camera and PLC, without a WAN dependency. |
| Operator HMI and immediate line status | Plant network | Available to operators on the floor without a WAN dependency. |
| Model training and architecture search | Cloud, where permitted | Provides training compute without consuming production-device capacity. |
| Cross-plant analytics and trend reporting | Cloud or enterprise analytics environment | Combines approved records across facilities. |
| Vision Events | Collected locally, synced to the cloud | Records survive connectivity gaps and become searchable in dashboards once synced. |
Hardware Options for Manufacturing Edge Inference
Edge hardware should be chosen around the production workload rather than a single compute specification. The most useful factors are how many frames each camera must process, whether the device needs environmental protection, its operating-temperature requirements, available I/O, and how long the hardware will remain supported. The table below compares common options for manufacturing vision systems.
| Hardware | FPS per camera | Ingress / temperature | I/O | Lifecycle |
|---|---|---|---|---|
| NVIDIA Jetson Orin Nano | About 25 FPS for RF-DETR on a single RTSP stream | Depends on enclosure, carrier, cooling, and complete system design | Ethernet, USB, MIPI CSI-2; industrial I/O depends on carrier | Commercial modules listed through January 2032 |
| NVIDIA Jetson Orin NX | 30 FPS per camera across four 720p streams, running RF-DETR Nano with TensorRT FP16 and DeepStream at around two-thirds GPU utilization; tracking and application logic not included | Depends on enclosure, carrier, cooling, and complete system design | Ethernet, USB, MIPI CSI-2; industrial I/O depends on carrier | Commercial modules listed through January 2032 |
| Industrial PC + GPU | Depends on GPU, model, resolution, and camera count | Industrial systems are available with IP-rated enclosures and extended temperature ranges | Ethernet, USB, PCIe; fieldbus and isolated I/O depend on system | Vendor and SKU dependent |
| Raspberry Pi 5 | About 4 FPS for a nano-sized detector, with no hardware acceleration available | Board-level device; add suitable enclosure and cooling for plant use | Gigabit Ethernet, USB, MIPI camera interfaces, GPIO | Production through at least January 2036 |
| Roboflow AI1 | 4K sensor captures at 30 FPS; inference runs on an onboard Orin NX, so throughput is comparable to that row | IP54; public specifications do not list an operating-temperature range | 24 V DC, M12 Gigabit Ethernet, industrial I/O harness | Five years of software support and OTA updates |
📖For a broader comparison, read Best Edge Devices for Computer Vision.
The camera architecture also affects the edge hardware choice. An integrated AI camera combines imaging and inference compute in one device, while an IP camera sends video to a separate edge computer for processing. AI cameras can simplify single-station deployments, whereas IP cameras can be a good fit when existing cameras are already installed or several streams share one Jetson or industrial PC.
📖For more details, read AI Cameras vs IP Cameras: What's the Difference?.
Step 1: Train and optimize the model for edge
Start with the throughput the production line actually needs. A 30 FPS camera delivers a new frame about every 33 ms, but the model does not always need to process every frame. The target should come from the line speed, number of cameras, inspection frequency, and the time available to make a decision.
For object detection, RF-DETR Nano and Small are practical starting points for edge deployment because they trade some model capacity for lower latency. The RF-DETR edge benchmarks report 2.32 ms for RF-DETR Nano and 3.52 ms for RF-DETR Small on an NVIDIA T4 using TensorRT FP16 at batch size 1.
If a standard model size does not match the deployment target, Roboflow Train also supports Neural Architecture Search. NAS evaluates different configurations such as image resolution, patch size, and decoder depth to find models suited to a specific accuracy and latency requirement. In the PCB example, a NAS-generated model reached 96.7% F1 at 1.9 ms compared with 96.4% at 2.3 ms for the RF-DETR Nano baseline.
After training, optimize the model for the target hardware. RF-DETR can be exported to ONNX for deployment with runtimes such as OpenVINO, while NVIDIA deployments can use TensorRT with FP16 for lower GPU latency. The RF-DETR exporter also supports direct TensorRT export.
Quantization can reduce model size and computation further, but it should be validated against the production dataset. RF-DETR supports FP16 and INT8 deployment options, and INT8 calibration should use representative images so that the optimized model is tested against the same defects and edge cases expected on the line.
The goal is not simply the highest possible FPS. Choose the smallest model and precision that meet the required inspection accuracy while leaving enough compute for video decoding, tracking, Workflow logic, and other processing on the edge device.
Step 2: Deploy with Roboflow Inference on the device
Once the model is trained, the production application can run locally with Roboflow Inference. Inference is the runtime that executes models and Workflows on edge hardware. It handles model loading, local execution, video decoding, hardware acceleration, and APIs so the application does not have to build a separate inference serving layer for each model architecture. For a self-hosted deployment, the basic process is:
pip install inference-cli
inference server start
The Inference server can then run a model directly or execute a complete Workflow containing detection, tracking, counting, filtering, business logic, visualization, and external integrations.
On NVIDIA Jetson or another NVIDIA GPU device, use the GPU-enabled deployment. Deployment Manager exposes an Inference Engine setting with four modes, where Auto lets the system choose the best available runtime including TensorRT, and TRT forces the TensorRT execution provider. Deployment Manager is an Enterprise feature and its devices need continuous internet access for remote management, so this path suits connected lines rather than isolated ones. Note that TensorRT-optimized packages for private models require an Enterprise plan when Inference runs outside the Roboflow platform, while public models include TensorRT packages on all plans.
When a model is requested for the first time, Roboflow Inference automatically downloads and caches its weights. Future predictions use the local copy, so camera images are not sent back to the cloud for inference. For plants with restricted connectivity, Enterprise Offline Mode extends this with the 30-day weight lease described earlier, and requires the Docker container rather than the Python package.
On AI1, the same edge architecture is packaged as a managed industrial endpoint. One IP54 device holds an 8 MP 4K sensor, a 4 mm S-mount lens, an integrated 8-LED ring, and an NVIDIA Jetson Orin NX with 8 GB and 1024 CUDA cores, running Workflows, Deployment Manager, HMI, and Vision Events on-device.
Step 3: Wire the output to the line
Detecting a defect is not enough. The production system needs a machine-readable decision. A Workflow might convert detections into:
qc_result = FAIL
reject_signal = true
defect_count = 1
The important design principle is that the vision system should determine what it sees, while the PLC should retain ownership of machine timing, safety interlocks, watchdog logic, and physical actuation.
Roboflow supports computer vision PLC integration using OPC UA, Modbus TCP, EtherNet/IP, and digital I/O. Enterprise Workflow blocks include OPC UA Writer, PLC Writer, Modbus TCP Writer, MQTT, and related integrations. For example, a Workflow can set:
Vision_InspectionComplete = TRUE
Vision_Reject = TRUE
Vision_DefectCode = 3
Vision_Confidence = 0.94
A Rockwell-based line could receive the decision as PLC tags over EtherNet/IP. A Siemens environment might exchange inspection values over OPC UA, while compatible AI1 deployments also list Profinet among supported plant protocols. AI1's current integration specifications explicitly reference Rockwell and Siemens systems alongside OPC UA, MQTT, Modbus TCP, EtherNet/IP, and Profinet.
The PLC then combines Vision_Reject with its own conveyor encoder, part tracking, interlocks, and reject-station timing. This is safer than having a Python application directly switch an actuator because control remains inside the plant's existing deterministic machine logic.
The same output can also drive an HMI. Instead of showing an operator raw bounding boxes, the HMI can display information such as:
PART 18472
RESULT: FAIL
DEFECT: Missing fastener
CONFIDENCE: 94%
ACTION: Reject
Meanwhile, the MES can receive the part ID, result, timestamp, defect code, model version, and other metadata needed for production reporting.
Step 4: Manage a fleet across plants
A single Jetson beside a conveyor is relatively easy to maintain. Fifty lines across ten plants are a different problem.
At enterprise scale, deployment becomes a fleet-management problem. Someone has to know which device is running which model, whether the stream is healthy, how much GPU memory is in use, whether a camera has gone offline, when software was last updated, and how an engineer can diagnose a remote site without travelling to the factory.
Deployment Manager provides the control plane for these deployments. It can provision supported devices with Roboflow Inference, configure streams, deploy Workflows, and monitor logs, stream status, telemetry, CPU, GPU, memory, and disk usage. It is an Enterprise feature, and its devices need continuous internet access for remote management and monitoring.
A deployment can therefore be managed from one place rather than treating each camera installation as an independent software project, which turns the work into a repeating lifecycle rather than a series of one-off installs.
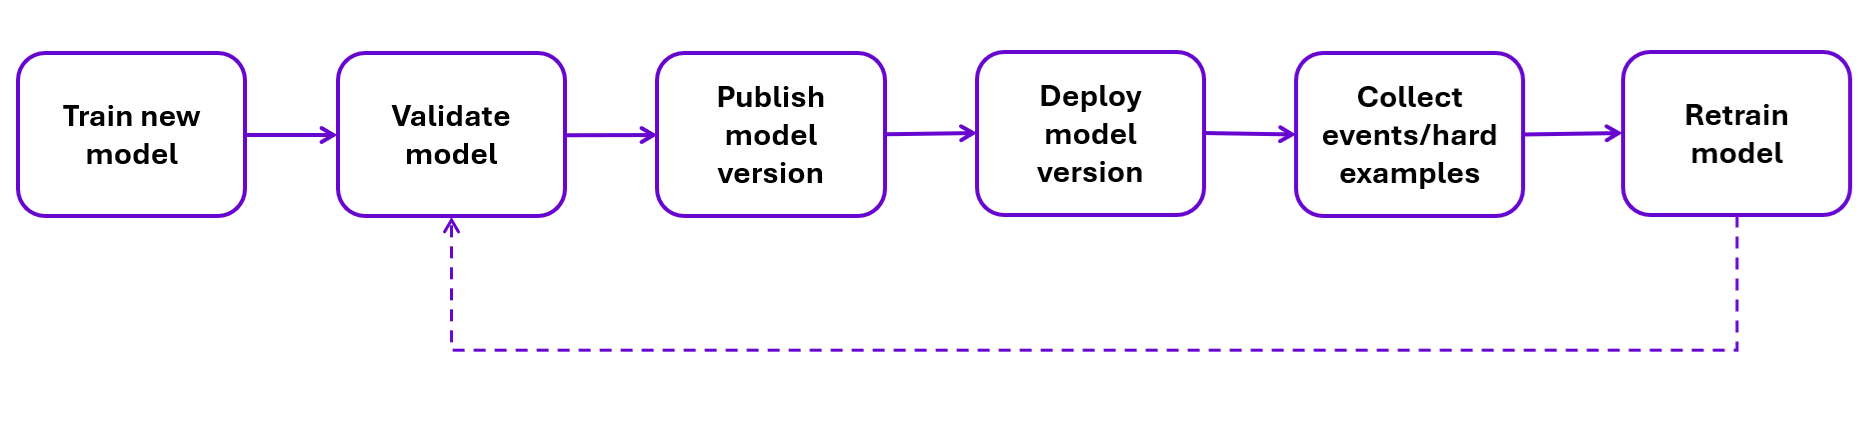
Deployment Manager also supports configuration of Inference and management-service versions. Automatic updates can be scheduled during defined maintenance windows, and the Inference Engine setting described in Step 2 can be changed from the configuration interface. Device logs can be viewed remotely and filtered by Roboflow service, while the resource monitor exposes CPU, GPU, memory, disk, and container status, so a plant engineer can manage many edge devices from one dashboard rather than logging into each site. For AI1 specifically, Roboflow provides five years of software support and OTA software and security patches.
One distinction matters for production planning. Remote configuration and scheduled updates are not the same as updates that cost no production time. An update still restarts a service, and a restart on an inspection station is a gap in coverage. If the station cannot tolerate that gap, confirm the update behavior against the plant architecture and plan around it with maintenance windows, redundant stations, or a production bypass.
Enterprise Requirements for Industrial Edge AI
Running a model fast enough to keep up with the line is only one part of a production deployment. Industrial edge AI also has to fit existing OT architecture, security policies, validation procedures, and quality systems.
In a Purdue-model architecture, vision edge devices sit inside the OT zone, usually somewhere between Level 1 and Level 3, close to the PLCs, HMIs, and plant services they work alongside. Traffic to cloud services should leave through the OT/IT DMZ rather than directly from the production network. Secure Gateway is built for exactly that pattern, proxying the routes Roboflow deployment servers need into the DMZ and caching model weights and container images locally, so a fleet of inference servers shares one controlled point of egress. It is the successor to the older License Server. For sites that allow no outbound path at all, self-hosted enterprise deployment adds Offline Mode so inference containers can run against cached weights.
Enterprise access should also be controlled through SSO for users and scoped API keys for devices and applications, so each system receives only the permissions it needs.
For regulated production lines, keep records of model versions, inspection results, validation tests, and changes. Under FDA QMSR, swapping a manual inspection step for an automated one is usually handled as a retained Letter to File rather than a new 510(k) submission, as long as the device itself does not change. The supporting evidence rests on IQ/OQ/PQ validation and a risk-based Computer Software Assurance approach that scales testing effort to process risk.
Automated inspection output also maps cleanly onto the core eQMS modules, with each failed inspection carrying the defect class, location, timestamp, and image that a nonconformance record needs, and full-coverage defect trend data feeding CAPA investigations. Every inspected unit leaves behind a timestamped image record, which gives an auditor photographic proof of what the part looked like and what the system decided, and serialized parts can carry those images through the device history record. The eQMS stays the system of record rather than the monitoring tool.
Finally, production models should be monitored after deployment. Vision Events records predictions, images, and custom metadata such as line, shift, and part number, with a configurable retention window that defaults to 14 days. Edge Device Backup stores events locally on the device and syncs them once connectivity returns, and flagged images can be pulled back into a project so active learning feeds real production examples into the next training cycle.
Conclusion
Edge inference is not a hardware preference. It follows from three constraints the plant imposes and the cloud cannot relax. The reject decision has a deadline measured in milliseconds, the camera produces more data than the network can carry, and the line has to keep running when the WAN does not.
Everything in this guide follows from those three. Hardware is sized for the whole pipeline rather than the model benchmark. The output arrives as PLC tags rather than bounding boxes. Fleet management, IT/OT segmentation, and audit records are what turn a working station into something a plant can operate and an auditor can review.
Start with one station, one camera, and one clearly defined decision. Train a small model, run it locally, and wire the result into the PLC before scaling to the next line.

 点赞
点赞 收藏
收藏 点踩
点踩 分享
分享