What Daily Stock Returns Tell Us About the Economy
One of the most enduring puzzles in finance is the apparent disconnect between Wall Street and Main Street—markets sometimes soar while the underlying economy stumbles, and vice versa. Paul Samuelson famously quipped that “the stock market has predicted nine out of the last five recessions” — capturing the frustration economists and investors have long felt trying to extract reliable economic signals from equity prices.
Fabrizio Ghezzi, author of the June 2026 paper “Main Street in Wall Street,” takes a fresh look at this puzzle and concludes that daily stock returns contain far more information about real economic activity than previously recognized. The apparent disconnect, Ghezzi argues, is largely a measurement problem — not a fundamental breakdown in the relationship between markets and the economy.
The Core Insight
Ghezzi decomposes daily stock returns into two distinct components: a high-frequency component that captures the “noise” of day-to-day trading — sentiment swings, liquidity effects, short-term speculation — and a low-frequency component that reflects the underlying fundamentals of the economy. Prior research tended to treat daily returns as a single noisy signal—explaining why the stock market often seemed disconnected from economic reality. Once you separate the signal from the noise, a strong and consistent relationship with real economic activity emerges.
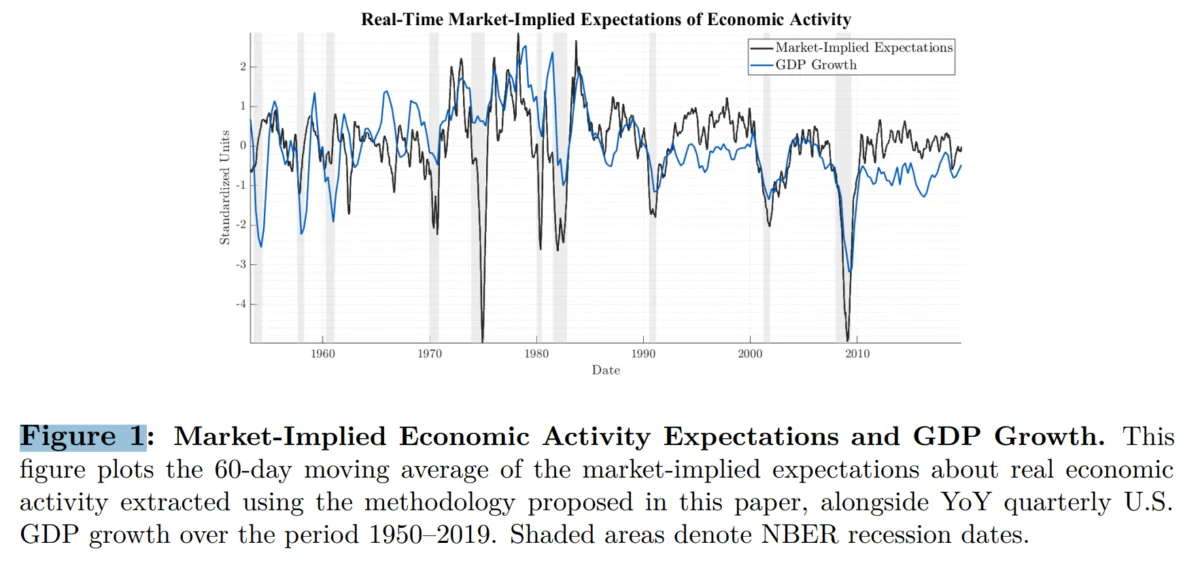
To extract this signal, Ghezzi develops what he calls “microfiltering” — a methodology built on a macro-finance framework that combines daily S&P 500 returns with four key macroeconomic releases: nonfarm payrolls, the unemployment rate, industrial production, and total capacity utilization. The intuition is straightforward. Daily stock returns are a continuous, but noisy, read on economic expectations. Macroeconomic data releases, while infrequent, serve as high-information anchors that allow the filter to identify the underlying economic signal embedded in returns. Using a Kalman filter (an algorithm for estimating and predicting the state of a system in the presence of uncertainty) that processes this mixed-frequency data in real time — respecting the actual release dates and preliminary nature of macro data — the methodology produces a daily series of what Ghezzi calls “market-implied expectations of real economic activity.”
What the Data Show
The results are impressive. The daily factor — estimated over the period 1950 through 2019 — closely tracks the business cycle. It declines sharply during every NBER-dated recession and recovers during expansions. Its autoregressive coefficient — a measure of how strongly today’s value predicts tomorrow’s — is near 0.99, indicating exceptional persistence. This makes intuitive sense: economies don’t whipsaw wildly from day to day. Recessions and expansions are slow-moving phenomena that build and unwind over months and quarters, not overnight.
The high persistence also has a practical implication: it means the factor is not just capturing random day-to-day market noise, but something more durable and fundamental — which is part of what validates it as a genuine measure of underlying economic conditions rather than a reflection of short-term market sentiment.
The factor is also left-skewed and fat-tailed, consistent with the well-known asymmetry of economic downturns relative to expansions.
When aggregated to lower frequencies and compared against standard benchmarks, the factor performs well. Its correlation with the Chicago Fed National Activity Index (CFNAI) at the monthly level is 0.80, and with real GDP growth at the quarterly level it is 0.50. Importantly, these benchmark series are used only for validation — they play no role in constructing the factor. Predictive regressions show the factor explains roughly 50% of the variation in next-month CFNAI and about 18-30% of next-quarter GDP growth, with statistically strong coefficients in both univariate and bivariate specifications that control for the lagged macro series themselves.
The factor also holds up well against higher-frequency measures of economic activity. Its correlation with the Philadelphia Fed’s daily Aruoba-Diebold-Scotti Business Conditions Index is 0.74, and it predicts that index with an adjusted R² of roughly 55% at both one-day and five-day horizons. It negatively predicts weekly initial unemployment claims — a leading labor market indicator — with predictive power that strengthens over an 8-week horizon. And it exhibits a correlation of 0.64 with the ISM Manufacturing PMI, which itself is a forward-looking survey of business conditions.
The results are hypothetical results and are NOT an indicator of future results and do NOT represent returns that any investor actually attained. Indexes are unmanaged and do not reflect management or trading fees, and one cannot invest directly in an index.
The Macro-Finance Linkages
Beyond simply tracking economic activity, the factor behaves as economic theory says it should. It positively predicts dividend growth and net equity payouts — consistent with the model’s prediction that higher economic activity leads to higher future corporate cash flows. The relationship with dividend growth peaks at a six-month horizon, with an adjusted R² exceeding 12%, reflecting the well-documented lag with which dividends adjust to economic conditions. It also predicts earnings yields at longer horizons, consistent with the same mechanism.
Equally important is what the factor does not predict. It shows no reliable predictive power for stock returns or inflation, which is precisely what you would expect from a measure of real economic activity rather than a financial or nominal variable. It negatively predicts realized market variance and credit spreads — both of which widen in downturns — and it predicts the term spread in a manner consistent with the expectations embedded in the yield curve.
One important advantage over existing tools: while the ADS index is updated only when new macroeconomic data arrives, the microfiltered factor updates every trading day, even on days with no macro releases, because it continuously incorporates the information in stock returns. This means it provides a genuine real-time signal rather than a series that goes stale between data releases.
His findings led Ghezzi to conclude:
“Daily stock returns contain systematic information about real economic activity, suggesting that macroeconomic information is rapidly and continuously incorporated into equity prices.”
Key Takeaways for Investors
First, the stock market is a better economic forecaster than its reputation suggests — but only if you know how to read it. Raw daily returns are too noisy to be informative about the economy. The signal is in the low-frequency component of returns, which can only be cleanly identified by accounting for the reactions of prices to macroeconomic news. Investors who look at day-to-day market moves and draw macroeconomic conclusions are likely reading noise, not signal.
Second, macroeconomic data releases matter more than their immediate market reaction might suggest. The methodology in this paper works precisely because macro releases serve as high-information events that sharply reduce uncertainty about the underlying economic signal. When a payroll report or industrial production figure surprises in either direction, the market’s response tells you something meaningful about the market’s revised expectation of where the economy is heading — a more useful signal than the raw number itself.
Third, the factor’s ability to lead standard macro indicators has practical value. Because it updates daily and correlates strongly with CFNAI and GDP growth, a suitably constructed version of this factor could in principle provide earlier recession warnings than the official data — which are released with lags, subject to revision, and only compiled into composite measures like the CFNAI with further delay.
Fourth, the factor’s behavior across business cycle phases is instructive. During expansions, the factor averages around 0.14 standard deviations above its mean; during recessions it averages nearly 0.87 standard deviations below. This asymmetry — combined with left skew and fat tails — is a reminder that the distribution of economic outcomes is not symmetric. Tail risk skews to the downside, and investors constructing portfolios should account for this rather than treating economic uncertainty as normally distributed.
Finally, this paper is a useful reminder that the Wall Street/Main Street disconnect, while real in the short run, largely dissolves once returns are properly decomposed. Financial markets are doing their job — aggregating dispersed information about economic conditions in real time. The challenge is extracting that signal from the considerable noise that accompanies it. Methodologies like microfiltering, which exploit the interaction between high-frequency financial data and lower-frequency macro anchors, represent a promising direction for turning the stock market into a more reliable macroeconomic instrument.
Larry Swedroe is the author or co-author of 18 books on investing, including his latest Enrich Your Future. He is also a consultant to RIAs as an educator on investment strategies. This article is for informational and educational purposes only and should not be construed as specific investment, accounting, legal, or tax advice.
was originally published at Alpha Architect. Please read the Alpha Architect disclosures at your convenience.

 点赞
点赞 收藏
收藏 点踩
点踩 分享
分享