The oldest US data series in FRED

FRED has not only current data series but also historic data series, some of which are very old. As we’ve mentioned on this blog, the oldest series in FRED is population data for the United Kingdom, dating back to 1086! The next 41 oldest series are also from the United Kingdom. Now that the United States is celebrating a quarter millennium of existence, let’s look at the oldest US series in FRED.
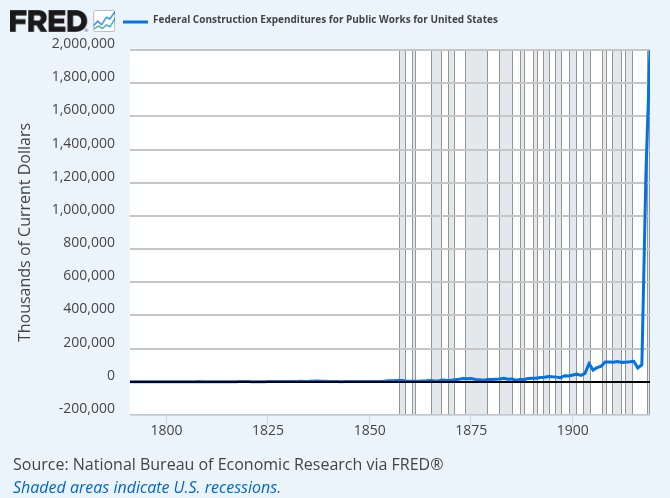
Our FRED graph above shows data on federal public expenditures, specifically for public works, that go as far back as 1791. More categories for public expenditures are available, with a couple also dating back to 1791.
The graph is dominated by the huge increase in military expenditures that came with WWI. Note that the data are calculated in current prices—that is, prices at the time, which have not been adjusted for inflation. And there’s no price series that is old enough to help reconcile this issue. Indeed, the data were computed retrospectively in 1920, which means that the data collection practices used were obviously not up to modern standards. In fact, it seems some liberties were taken with the definitions of the data. For example, the little bump in 1904 corresponds to the purchase of the Panama Canal and land around it: $40 million to France and $10 million to Panama.
How this graph was created: From the FRED home page, go to the “Browse Data By” list on the right side and choose “Category.” From the Categories page, go to the “Browse Data” list on the left side and choose “All Series.” From the All Series page, change “Sort by Popularity” on the right side of the listing to “Sort by Obs Start.” From this oldest series list, choose the first US series.
Suggested by Christian Zimmermann.

 点赞
点赞 收藏
收藏 点踩
点踩 分享
分享