
Separating Storage From Compute on EC2, Part 4: Database DR Restore


TL;DR The restore is the primary’s own Terraform flipped to live in the DR region: it imports the warm volume from Part 3, puts compute in front of it, and replays the shipped log to the end of the archive. In PostgreSQL and MySQL tests the worst replay failures were silent, so a restore ends on a position check against the archive, not on an exit code.
Part 3 left a hydrated, tagged data volume in the DR region with nothing attached to it, and the WAL or binlog waiting in the S3 archive. This part covers the flip to live, the replay that follows it, and the two places where the tooling reported a finished restore that wasn’t.
Flip the cluster to live
The flip is the same module applied with the region’s mode set to live. Until now Terraform has never held the DR region’s data volume, because the state machine kept replacing it. The flip takes it over in one apply: a lookup finds the volume by its tags, an import block brings it into state, and an instance is launched in front of it.
The lookup filters on ReadyAt, the tag on the volume, not on the tracker’s record, since the record can already name a newer copy whose volume is still being built. The cluster’s first region never received a copy and starts with an empty volume, and the tracker’s parameter tells the two cases apart:
 1
 2
 3
 4
 5
 6
 7
 8
 9
10
11
12
13
14
15
16
17
18
19
20
21
22
23
24
25
26
27
28
29
30
31
32
33
34
35
locals {
 compute = var.mode == "live"
 # A region that has received DR copies restores from one; the first region starts empty.
 from_dr = local.compute && data.aws_ssm_parameter.dr_copy.value != "none"
}

# The volume Part 3's state machine built, found by its tags.
data "aws_ebs_volume" "ready" {
 count = local.from_dr ? 1 : 0
 most_recent = true
 filter {
 name = "tag:DrSet"
 values = [var.cluster]
 }
 filter {
 name = "tag-key"
 values = ["ReadyAt"]
 }
}

import {
 for_each = local.from_dr ? { data = data.aws_ebs_volume.ready[0].id } : {}
 to = aws_ebs_volume.data[0]
 id = each.value
}

resource "aws_ebs_volume" "data" {
 count = local.compute ? 1 : 0
 availability_zone = var.availability_zone
 size = local.from_dr ? data.aws_ebs_volume.ready[0].size : var.data_size_gib
 snapshot_id = local.from_dr ? data.aws_ebs_volume.ready[0].snapshot_id : null
 lifecycle {
 ignore_changes = [snapshot_id, tags]
 }
}
The instance and the volume attachment sit under the same compute gate. A region flipped straight from cold has no tagged volume yet, so the state machine runs there once first and the initialization lands inside the RTO.
The flip itself is the decision to fail over, and it belongs to a person. A wrong automatic failover leaves two primaries and a split write history, which costs far more than the minutes spent reading dashboards. A hand-run runbook keeps judgment at every step but drifts from the infrastructure it describes. A stack that the weekly drill flips to live cannot drift that way.
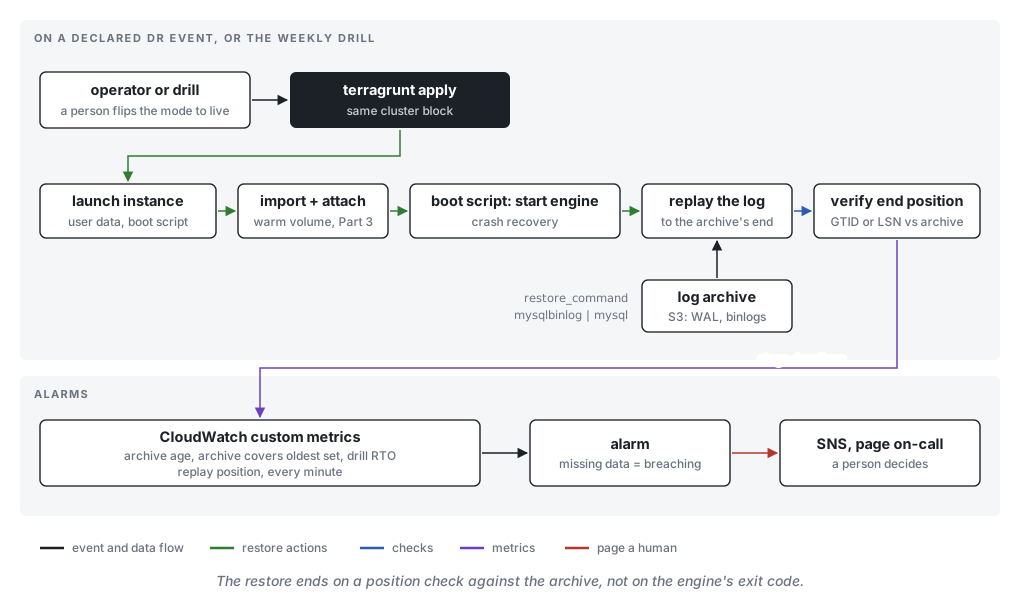
From there the host restores itself. The boot script starts the engine in recovery, replays the shipped log, and publishes its position to CloudWatch once a minute until it reaches the end of the archive. It does this only on the volume’s first boot in the region and then tags the volume as restored, so replacing the instance later just starts the engine. A replay that hangs stops publishing, and the alarm below treats missing data as breaching.
Replay to the end of the archive, then check where it stopped
The snapshot gives an engine on a crash-consistent set. Everything written after it comes from the log, and both engines can finish that replay short of the archive’s end without saying so. I reproduced both cases in Docker, killing a primary under insert load and restoring from a frozen copy of its data directory.
On PostgreSQL, archive_command ships only completed WAL segments, which the docs state plainly. The segment that was being written when the primary died never reached the archive. The restore replayed everything that had, logged archive recovery complete, and promoted itself about two seconds of writes short, with nothing in the log to hint at it. A pg_receivewal stream keeps that last segment as a .partial file, and pointing restore_command at it as a fallback brought the restore to within one transaction of the primary.
On MySQL the trap is the exit code. After a crash the newest binlog file usually ends mid-event, and mysqlbinlog reports that with exit status 1. A file damaged in the middle of the archive produces the same status and the same error text, and mysqlbinlog stops there without reading the files after it. One case is a normal crash. The other is a hole that silently drops every write after it.
The exit code can't tell these apart A boot script that fails on any non-zero exit pages on every real disaster, and one that ignores it can promote a server missing hours of writes. Check the archive instead. On MySQL, every closed binlog ends in a Rotate event naming its successor, and after replay gtid_executed reaches the last complete transaction in the newest file. On PostgreSQL, the position where redo finished matches the newest segment in the archive.
Alarm on the archive
Part 3’s alarms say whether the warm volume is recent. Nothing there says whether the log reaches back to it, so these are custom metrics, published by Part 3’s sweep and by the drill, with thresholds taken from the plan:
| Metric | Published by | Threshold comes from | Missing data |
|---|---|---|---|
| age of newest object in the log archive | sweep | the RPO, minus the time it takes to respond | breaching |
| archive covers the oldest retained set (0 or 1) | sweep | oldest set’s start time vs oldest log object, plus a gap check | breaching |
| replay position | boot script, every minute while replaying | any gap over a minute means the replay hung | breaching |
| drill RTO | drill run | the RTO target | breaching |
The archive-age alarm assumes the primary is writing. An idle PostgreSQL primary stops switching segments, since archive_timeout only fires after database activity, and an idle MySQL primary leaves its binlog untouched. A heartbeat row updated every minute makes the metric measure the pipeline instead of the traffic.
Coverage is the alarm to build first. A retained snapshot set is worth something only if the archive reaches back to it without a gap. The usual ways to lose that are a lifecycle rule on the log bucket that expires objects sooner than the snapshots, and a shipper restarted from the wrong file. Both stay silent until a restore runs out of log, and the warning above shows that even then the failure may look normal. The sweep already lists everything the check needs: the oldest log object predates the oldest set, segment names are consecutive, and every closed binlog ends in a Rotate.
Drill the chain weekly and keep its numbers
A scheduled rule runs the same module in live mode, as a separate Terragrunt unit in an isolated network, and destroys it once the checks have published. The drill never imports the standing warm volume. A replay writes to its volume, and the next real failover needs one that has never been restored. So the drill switches the lookup and the import off, builds its own volume from the recorded copy, and also runs with its own server ID and with archiving off.
A drill that archives can redirect the next restore archive_command travels in the primary’s configuration along with restore_command. On PostgreSQL, a drill that kept it wrote a new timeline into the shared archive, and a later restore followed that timeline by default, because recovery_target_timeline defaults to latest, and came back missing the primary’s newest writes. Drills run with archive_mode = off, the bucket denies writes from the drill’s role, and live mode sets recovery_target_timeline = 'current'.
The boot script stamps each stage (instance up, engine accepting connections, replay done, position verified), so a weekly chart shows which stage is growing. Together with Part 3’s tracker, that yields the four numbers Part 2 left open. Copy time comes from the copySnapshot events. The freeze window comes from DLM’s script events. Shipping lag is the archive age at the primary’s busiest hour. Replay rate is log bytes over the replay stage’s duration.
Replay rate is the one Part 2’s interval decision was waiting for. Take the RTO left after launch and initialization, divide by the replay rate, and you have the most log a restore can afford to replay. That is the snapshot interval.