
My Perdix writes its tissue loadings into every dive log


Every four minutes during a dive, my Perdix 2 writes down the nitrogen and helium loading of all 16 compartments in its Bühlmann model. The numbers sit in the dive log as six records of type 0x70 to 0x75. Shearwater’s desktop parser names those record types and hands them to its handler for unknown records. libdivecomputer doesn’t define them at all, so Subsurface never sees them either.
I’ve written the layout into the pnf spec. This post is about how I know what the numbers mean, how closely a textbook model reproduces them, and eight values in each snapshot that I can’t account for yet.
Six records, 41 floats
A snapshot is six consecutive 32-byte records, 0x70 through 0x75, always in that order. Bytes 1 to 3 of each record are zero, and from byte 4 on, the payload is little-endian IEEE 754 float32. Everything else in the format is a big-endian integer, which is part of why these records looked like noise for so long. Each of the first five records holds seven floats. The sixth holds six, followed by a big-endian 32-bit timestamp in its last four bytes. That makes 41 floats per snapshot:
| floats | what they hold |
|---|---|
| 0 to 15 | nitrogen loading of compartments 1 to 16, in bar |
| 16 to 31 | helium loading of compartments 1 to 16, in bar |
| 32 to 39 | unidentified, see below |
| 40 | zero |
My Shearwater Cloud database holds 146 logs, 126 from the Perdix 2 and 20 from a Petrel 3. Between them they contain 1,518 snapshots, and every one has all six records in order. Float 40 is zero in all 1,518.
How I know they’re tissue pressures in bar
A diver who has been at the surface long enough has every compartment at the nitrogen pressure of the air they breathe. With Bühlmann’s water vapour correction, that’s (surface pressure − 0.0627) × 0.7902. In one log the Perdix recorded a surface pressure of 1.020 bar, so the expected value is (1.020 − 0.0627) × 0.7902 = 0.7565 bar. The first snapshot in that log reads 0.757 in every nitrogen compartment, and 0.001 in every helium compartment.
34 of my 146 logs start like that, with all 16 nitrogen values within 0.01 bar of the air value. The rest start higher, because they were second or third dives of the day and the slow compartments were still carrying nitrogen from the dive before.
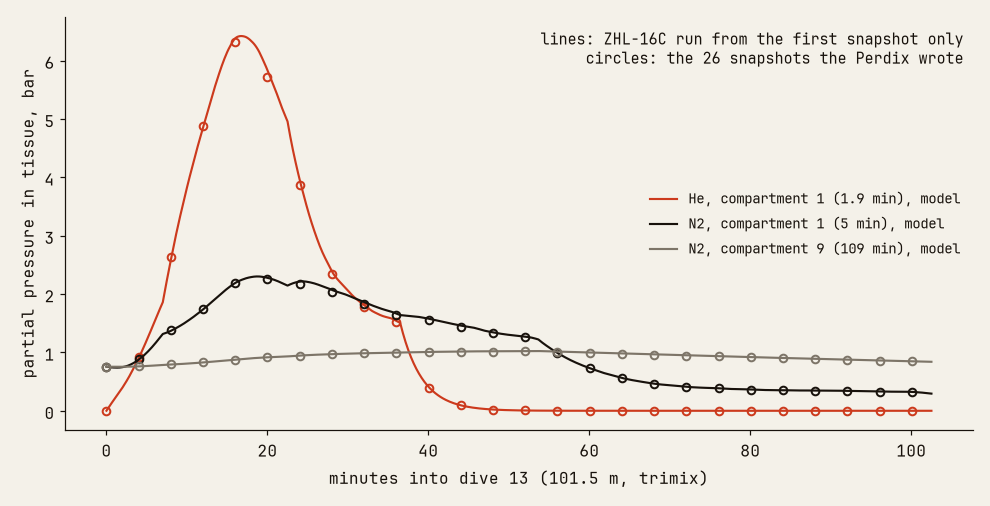
The helium values stay near 0.001 on air and nitrox dives and climb only on trimix. The largest helium value in any snapshot is 6.32 bar, in compartment 1 at 97 metres on a 101 metre dive, breathing 11/63.
The timing is regular. The first snapshot comes before the first depth sample in all 146 logs, and in 145 of them its timestamp equals the dive’s start time, so it records the tissue state the dive began with. After that, snapshots arrive every 238 to 243 seconds, with 24 or 25 ten-second samples between them.
A textbook model reproduces them
If these are the computer’s tissue loadings, then a plain ZHL-16C model started from one snapshot and fed the log’s depth and gas should arrive at the next snapshot. I used the published ZHL-16C half-times and the same water vapour constant, converted depth to pressure with the surface pressure and water density the log itself records, and on rebreather dives subtracted the loop’s ppO2 before splitting the rest between nitrogen and helium. The model starts at one snapshot’s values, steps through the 10-second samples to the next snapshot’s timestamp, and then compares all 32 numbers. The code is the same model that bottomtime uses for surface GF.
There are 1,372 of those four-minute stretches across my logs. The median error is 0.0004 bar for nitrogen and 0.0001 bar for helium, and 95% of nitrogen values land within 0.009 bar. In 1,359 stretches, no compartment is off by 0.05 bar or more.
The other 13 all miss in the fastest compartments: helium compartment 1, whose half-time is 1.88 minutes, eight times, nitrogen compartment 1 four times, and nitrogen compartment 2 once. A compartment that gets halfway to a new pressure in under two minutes is the one where 10-second samples are coarsest, especially across a gas switch or a fast descent.
Running the model from the first snapshot alone, without resetting it at each later snapshot, still follows the whole 101 metre dive. Across its 26 snapshots, the median of each snapshot’s worst error is 0.016 bar.
GF99 trails the tissues by about 30 seconds
GF99 is how close the leading compartment is to its Bühlmann limit at the current depth, and the Perdix logs it in every sample. From a snapshot’s 32 numbers I can compute GF99 myself. Comparing that with the GF99 the Perdix logged at the snapshot’s timestamp, over the 183 snapshots where the logged value was 5 or more, the median disagreement is 2.45 points. Comparing with the GF99 logged 30 seconds later, it’s 0.94.
The offset could be in the snapshot’s clock or in GF99. I tested the clock by shifting the samples against the snapshot timestamps and rerunning the prediction above. The median worst error per stretch is smallest, 0.005 bar, within 10 seconds of no shift. Shifting the samples 30 seconds earlier raises it to 0.008 bar, and 30 seconds later to 0.014. So the snapshot timestamps line up with the samples, and the GF99 in the sample records lags the tissue state by about half a minute. I don’t know why.
Eight numbers that look like a second model
Floats 32 to 35 behave like nitrogen loadings and floats 36 to 39 like helium. None of them equals any of the 32 Bühlmann values in the same snapshot or the one before. At rest, floats 32 to 35 read between 0.794 and 0.798, which is higher than the 0.757 the Bühlmann compartments read at the same moment, and floats 36 to 39 read zero.
On the 101 metre dive, floats 32 to 35 rise one after another:
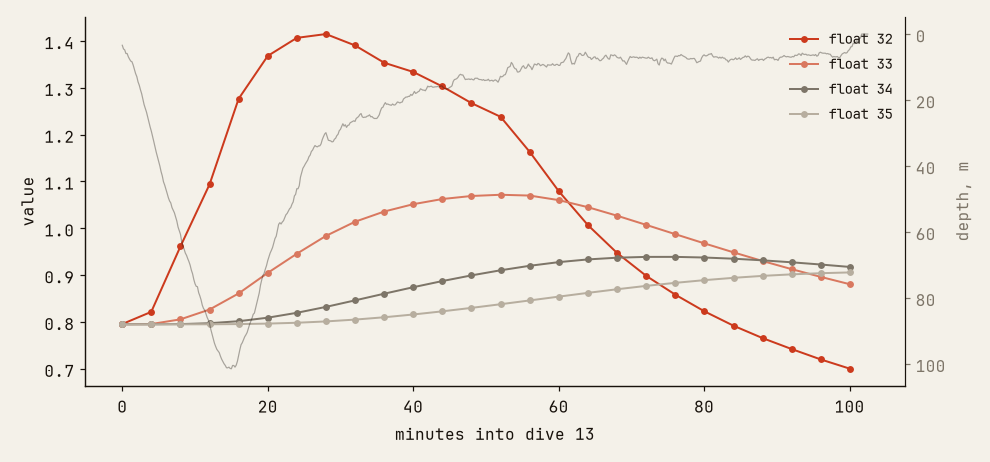
Float 33 hasn’t moved four minutes in, and float 34 barely moves for the first twelve, while float 32 is already climbing. Parallel compartments, the kind Bühlmann uses, all respond to a change in ambient pressure straight away, the slow ones by less. A chain of compartments in series behaves like this instead, with each one filling from the one before it.
Shearwater sells DCIEM as an upgrade for its computers. DCIEM’s model, from the Canadian defence research institute of the same name, is described as “diffusion-limited gas exchange with four serial compartments”, with a parameter set that “has not been published in public”. Four compartments in series, tracked for nitrogen and for helium, is what floats 32 to 39 look like. On dives set to DCIEM, Shearwater’s desktop parser reads sample bytes 24 and 25 as a safe ascent depth instead of the ceiling and GF99 it reads there otherwise, so the computer does carry DCIEM-specific output in its logs.
I can’t test this. All 146 of my logs use gradient factors. If you have Shearwater logs from a computer set to DCIEM, I’d like to know whether floats 32 to 39 track the safe ascent depth those logs record.
What the snapshots are good for
bottomtime estimates surface GF, which the Perdix shows during a dive but doesn’t log. Before I decoded the snapshots, it had to rebuild the tissue state at the start of a dive by replaying every dive from the 48 hours before, which only works if every one of those dives is in the store. Now it starts from the first snapshot, the state the Perdix recorded.
The bigger use is checking. A dive log that carries the computer’s model state lets anyone compare that state against the published model, using their dives, without having to trust either one. On my logs, the median disagreement between the published ZHL-16C and the Perdix is under a thousandth of a bar.
Sources
- pnf SPEC.md §7.1, the snapshot layout
- libdivecomputer’s Shearwater parser, the record types it defines
- bottomtime’s
deco.py, the ZHL-16C constants and model - Risberg et al., Appendix 1, Diving and Hyperbaric Medicine, 2023, on the DCIEM algorithm
All numbers come from the 146 logs in my Shearwater Cloud database as of 24 October 2026, decoded with pnf.