UI freeze reports are now available in JetBrains Marketplace

A user reports that the IDE stopped responding, and your plugin is the prime suspect. You try the same steps, but everything works. Without more details, such as a thread dump captured during the freeze, it’s hard to know where to start.
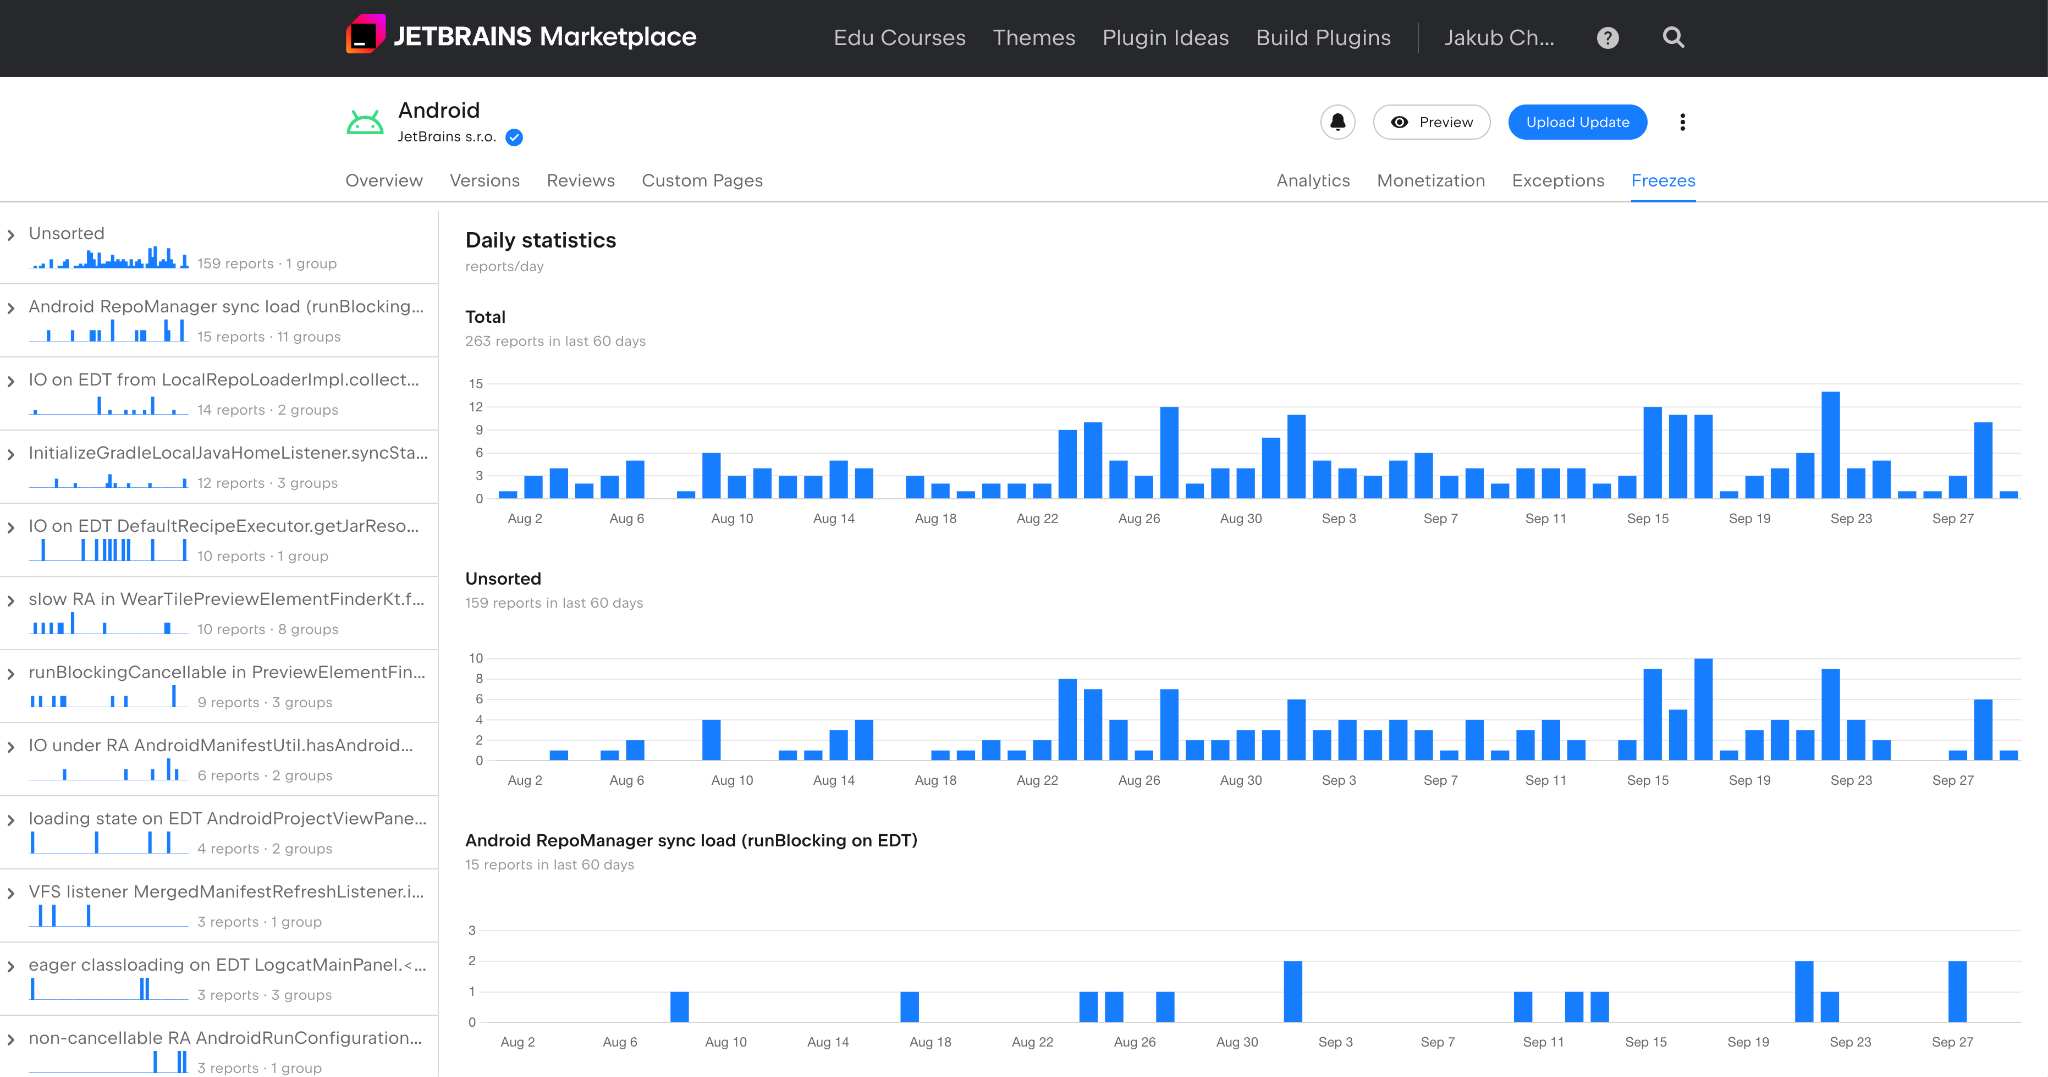
JetBrains Marketplace now gives plugin authors access to UI freeze reports attributed to their plugins. To see them, open your plugin’s management page and select the Freezes tab.
There’s one catch: you need to enable Marketplace reporting in your plugin first. Hopefully, the tab stays quiet, but it’s worth setting this up before you need it.
What is in a freeze report?
Marketplace groups freeze reports by error type and collects similar reports into piles. Each pile shows a representative report, so you can spot recurring patterns without opening every occurrence.
The automatically generated thread-dump excerpt gives you a starting point by showing the threads identified as involved in the freeze. It’s also a good first input for a coding agent: the short excerpt helps it get oriented while using fewer tokens than the full dumps. For a deeper investigation, use the analyze-freeze skill, then add the full dumps so the agent can trace connections between threads or coroutines.
The dump-N.txt files contain full thread dumps captured every five seconds during the freeze. Depending on what the IDE was able to capture, the report may also include:
snapshot.jfr, a CPU snapshot.report.txt, an analysis of the captured thread stacks.open-telemetry-metrics.csv, performance metrics covering areas such as VFS activity and UI responsiveness.
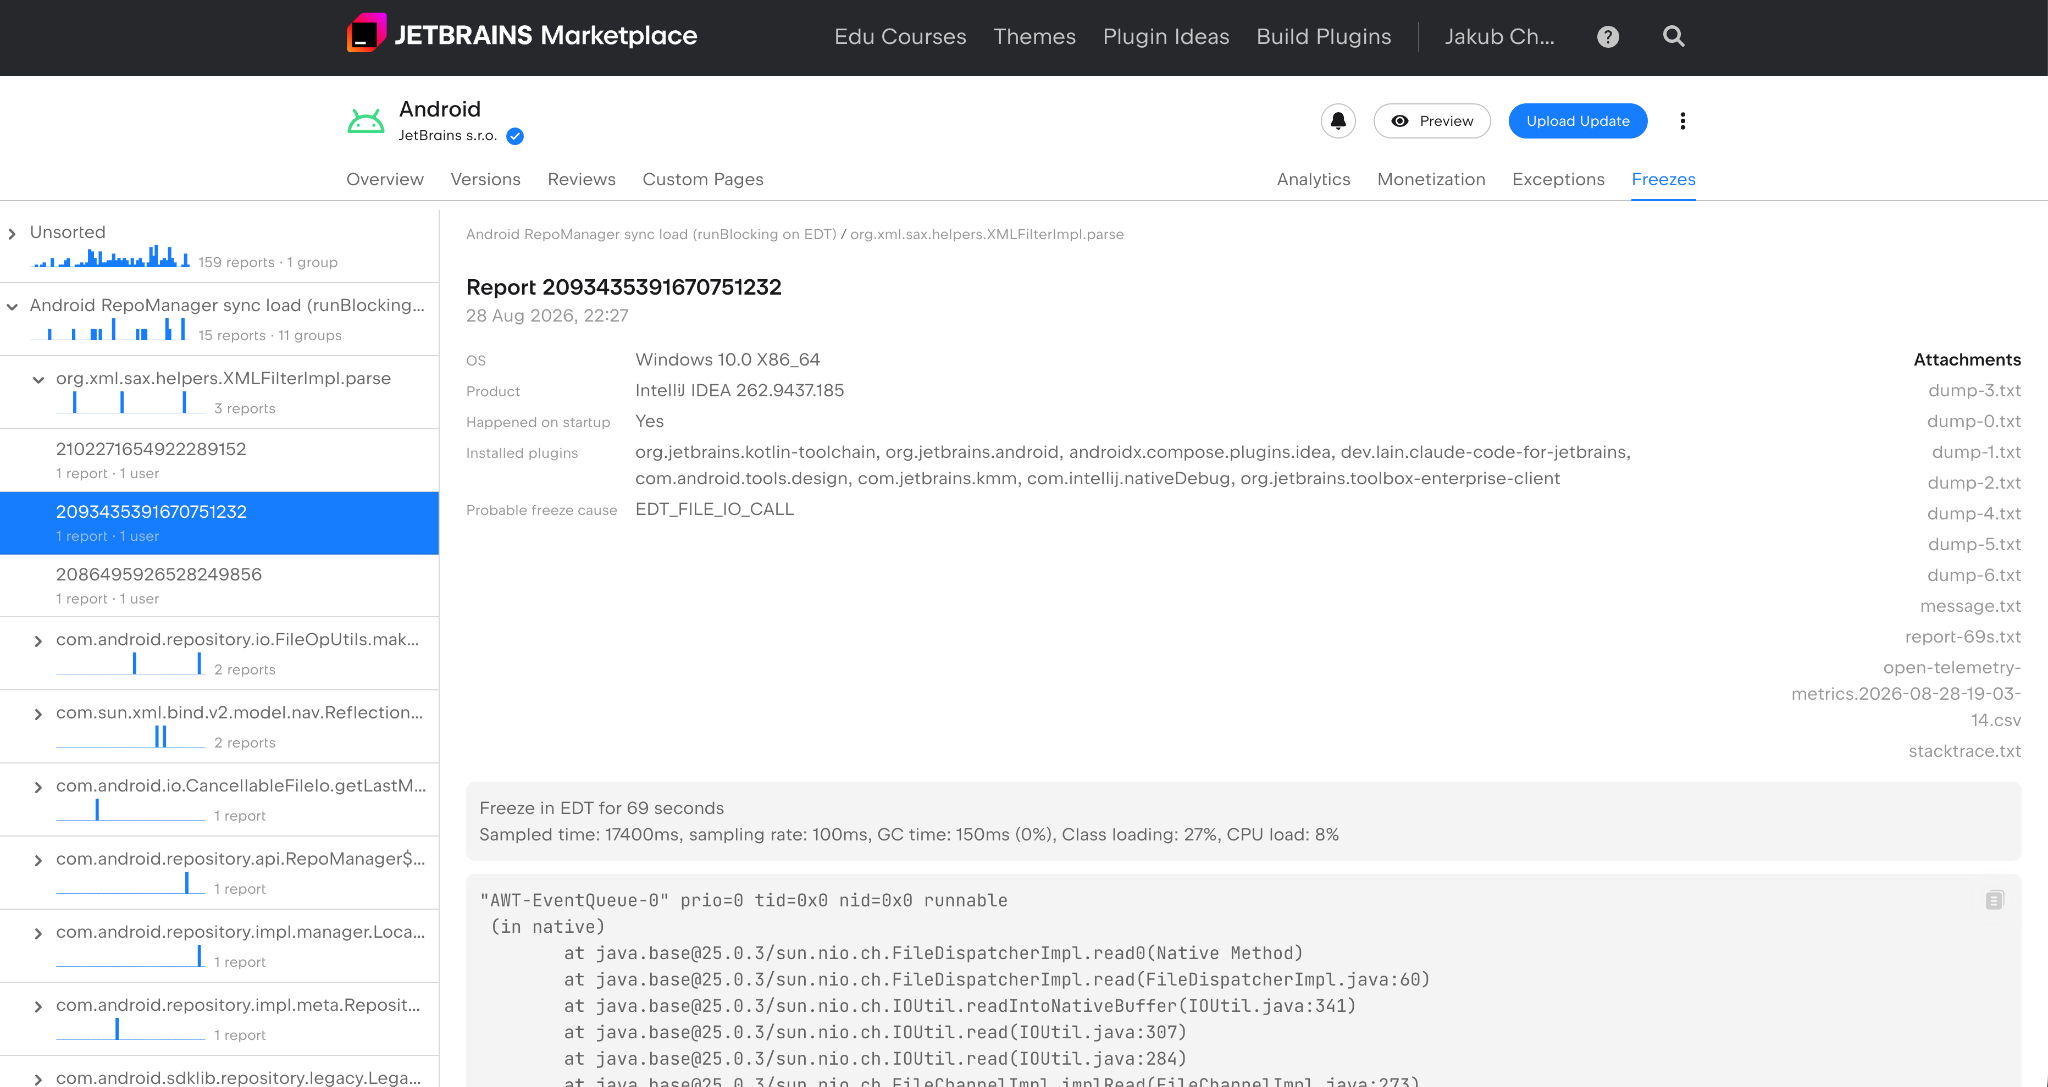
Start with one report
Open a report and find the event dispatch thread (EDT) in its excerpt. It is usually named AWT-EventQueue-0 or contains EDT. First, check whether the EDT is busy doing expensive work or waiting for something else to finish.
To investigate further, download a full dump and use Search Everywhere in the IDE to open Analyze Stack Trace or Thread Dump. Paste the dump text and inspect the results. As you trace what prevents the EDT from progressing, refer back to the original thread data. If several dumps are available, compare them to see whether the same operation remains on the stack across samples.
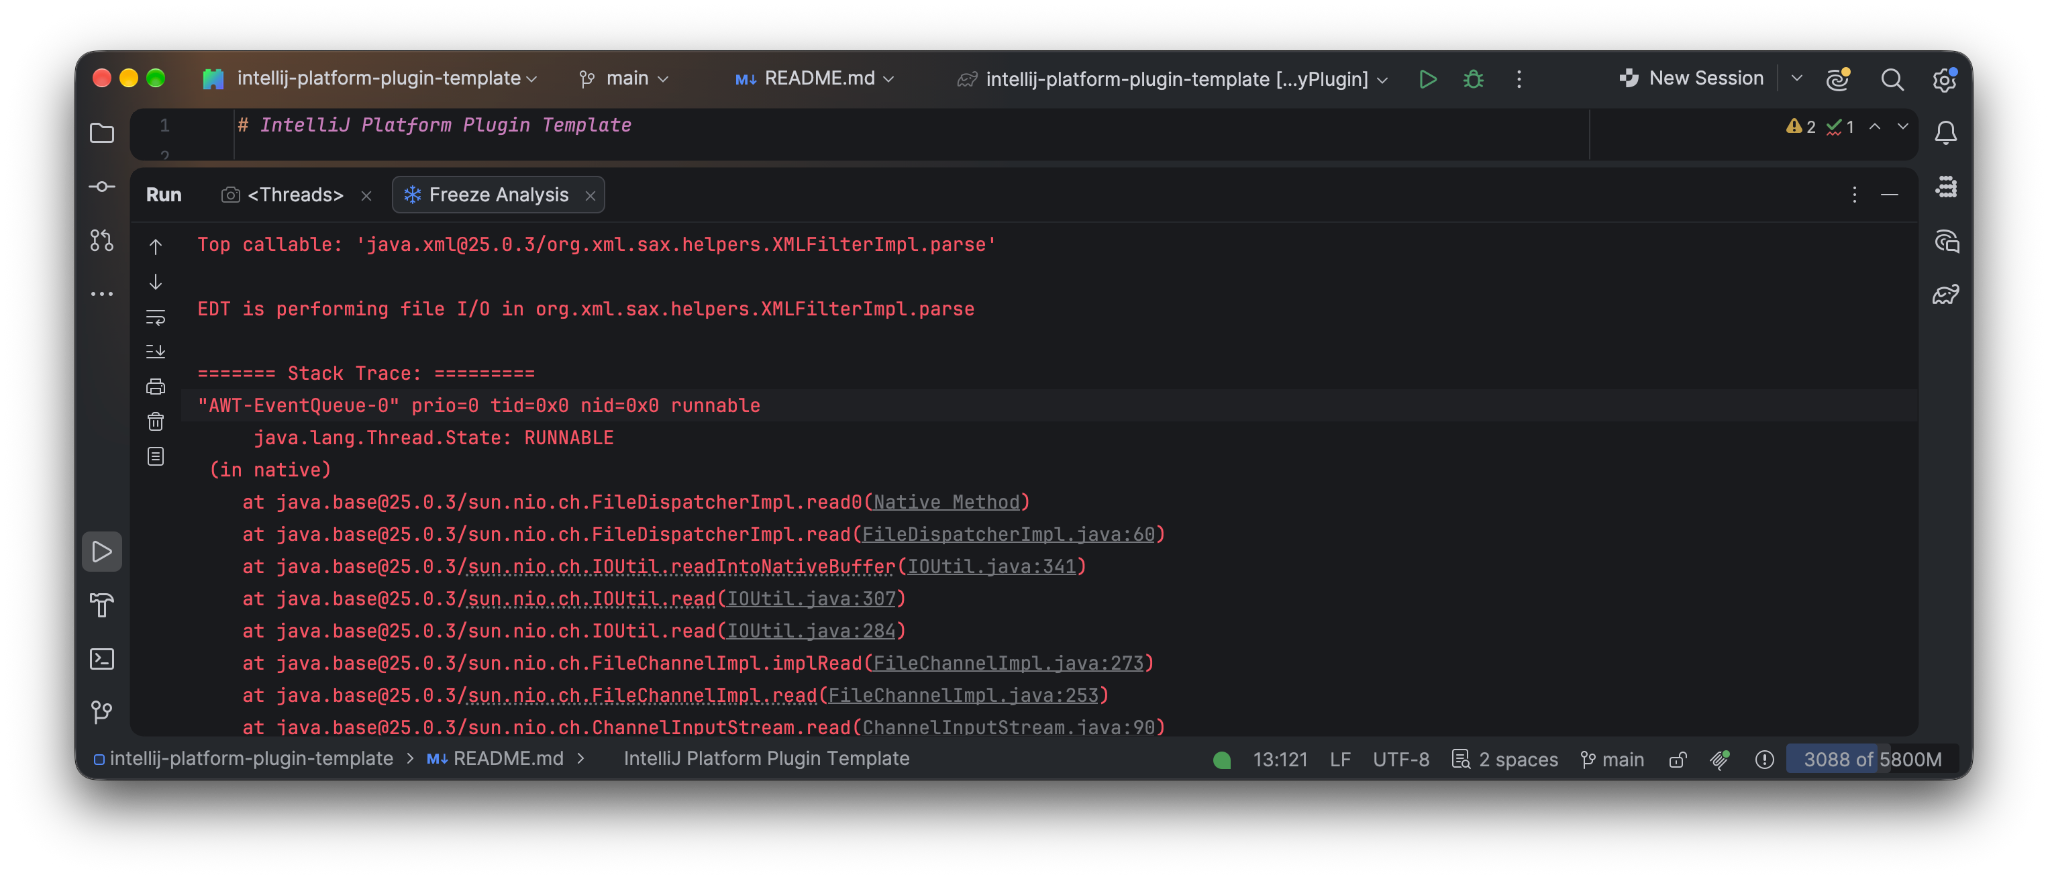
In the example below, the analyzer identifies file I/O on the EDT in org.xml.sax.helpers.XMLFilterImpl.parse.
The cause can also be on a background thread. A long, non-cancellable read action may hold a lock needed by a write action, leaving the UI waiting even though the expensive work runs elsewhere. UI Freezes and the Dangers of Non-Cancellable Read Actions in Background Threads walks through this pattern and explains how to address it.
Try the freeze-analysis skill
Our colleague Patrick Scheibe created the analyze-freeze skill to help AI coding agents investigate IntelliJ Platform thread dumps. It includes guidance on coroutine behavior, Dispatchers.Default starvation, and other common freeze patterns, along with suggestions for fixing them.
To try it:
- Save the gist’s
SKILL.mdin your investigation folder. - Add the downloaded full thread dumps, along with
report.txtand coroutine-dump text if available. - Ask your agent to read the skill and analyze those files with this prompt:
Read SKILL.md and apply its analyze-freeze instructions to the attached IntelliJ Platform thread dumps.
Start with the EDT, then trace what prevents it from progressing.
Identify the relevant code frame, participating threads or coroutines, any service involved, and the probable plugin.
Cite the dump evidence for each conclusion. Distinguish observed facts from hypotheses.
If the excerpt or dumps are insufficient, say which evidence is missing.
Suggest a minimal fix and how to validate it.
Do not edit code yet.
Before sharing dumps with an AI service, follow your project’s process for handling diagnostic data. Use the agent’s explanation to guide your investigation, and check the cited frames against the full dump and your code before making changes.
Enable Marketplace reporting
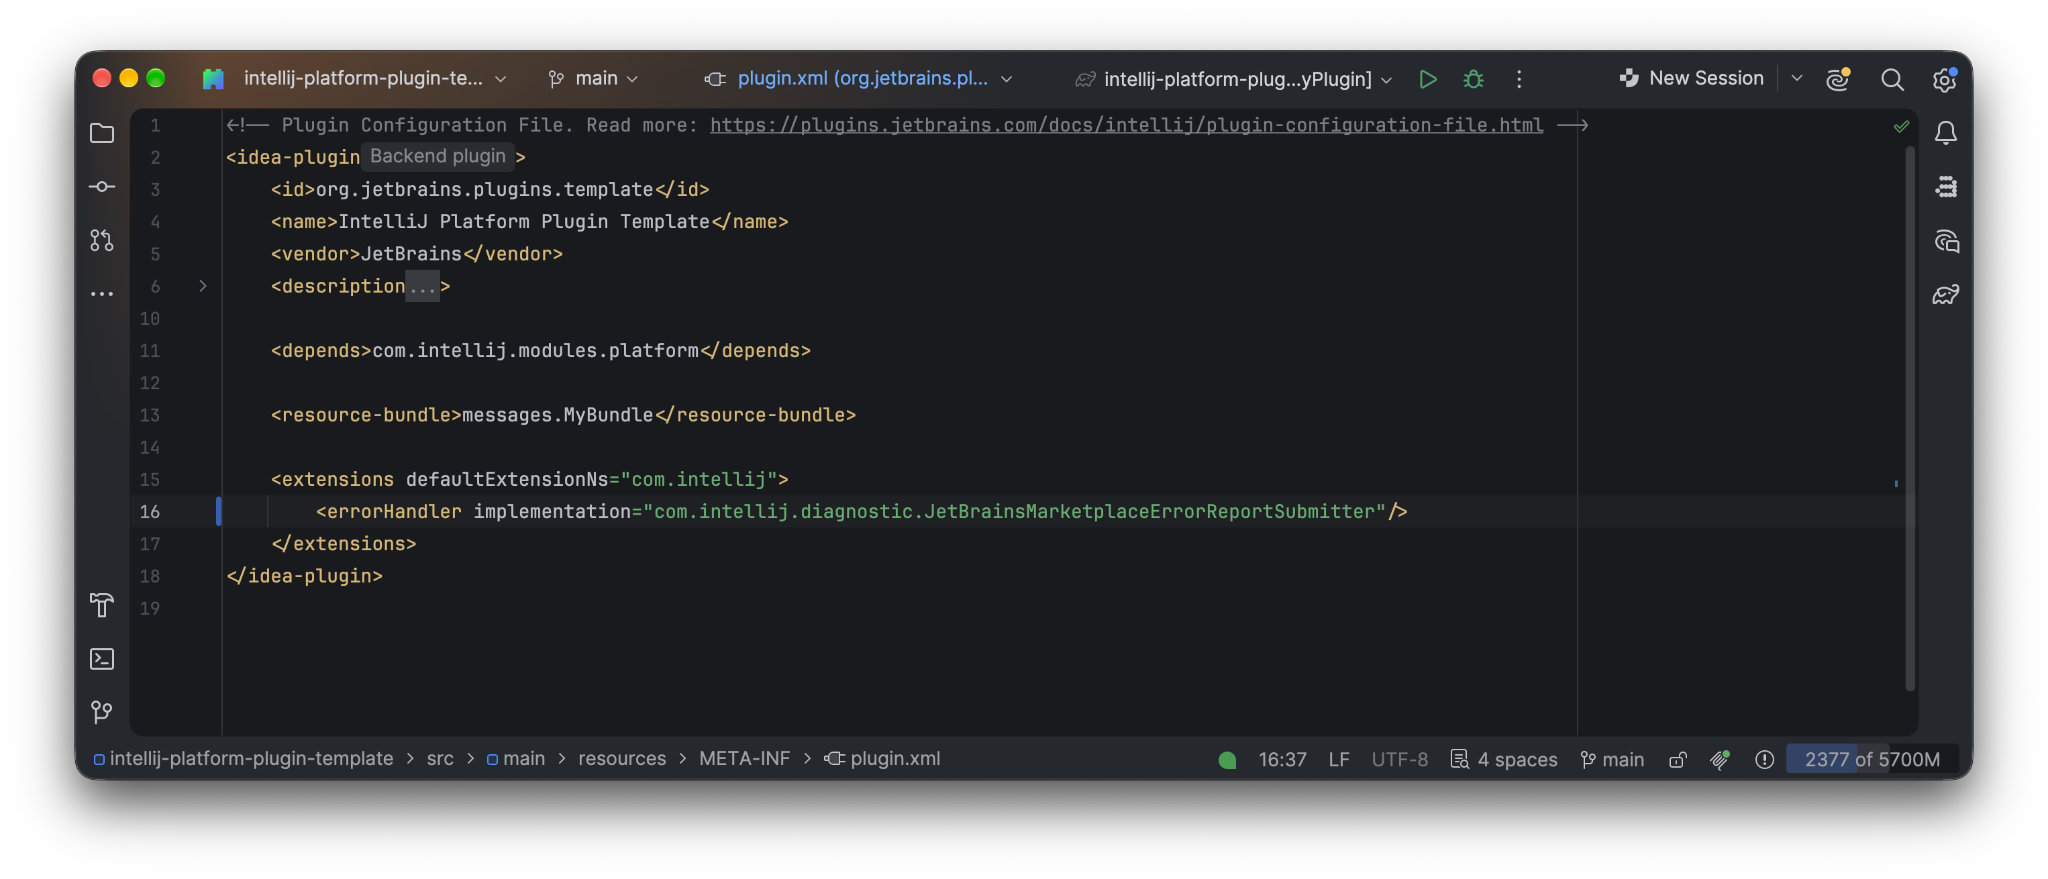
To use Marketplace’s built-in reporting, register its error handler in plugin.xml:
This handler has been available since IntelliJ Platform 2023.3 and requires no custom implementation. For plugins that support Split Mode, register it in a frontend or shared plugin module. A backend-only registration will not make it available to the frontend.
Users can submit reports through the IDE’s error-reporting UI or enable Send error reports to JetBrains automatically to send them in the background. If the Freezes tab is empty, check your handler registration. Reports also depend on the user’s settings and whether the IDE identified your plugin as being involved.
If you maintain a custom reporting backend, the SDK error reporting guide explains the user-facing ErrorReportSubmitter API and the experimental ErrorReportSink API for automatic background reports. You don’t need a custom sink for the built-in Marketplace setup described here.
For a video overview, Patrick Scheibe’s How IntelliJ Plugin Error Reporting Actually Works compares Marketplace reporting with a custom ErrorReportSubmitter. It also covers what gets submitted and why attachments matter for freeze reports.
Check the evidence before choosing a fix
Before matching a dump to your code, check which plugin version it came from. Version information is not always available, making it difficult to identify the affected release or deobfuscate a stack trace. If the version is missing, keep it marked as unknown rather than assuming the report came from your latest release.
Once you have a likely cause, focus on the operation preventing the UI from progressing. For a long background read action, this may mean shortening the time spent accessing the model or choosing a cancellable read-action API. Keep blocking I/O outside the read action, and make sure any computation that can restart is safe to retry.
Test the change by repeating the affected operation and examining fresh diagnostic evidence. If you’re still stuck, ask in the JetBrains Platform Forum with the IDE build, plugin version if known, relevant dump evidence, and what you’ve already checked.
Even when you can’t reproduce a freeze, its full dumps show what the IDE’s threads were doing during the stall and give you a place to investigate. If Marketplace reporting is enabled for your plugin, visit its Freezes page and check for reports; the short excerpts can help you decide where to look first. Good luck with the investigation, and happy debugging!

 点赞
点赞 收藏
收藏 点踩
点踩 分享
分享