Hand-writing a Blackwell GEMM: 164 to 1400 TFLOP/

I wanted to know what a fast matrix multiply on Blackwell is made of. Not the API calls, the reasons behind them. So I wrote one from scratch on a single B200, in CUTLASS's Python DSL (CuTeDSL), using the raw primitives (tcgen05, TMA, mbarriers, TMEM) and none of the helper abstractions that ship in the CUTLASS repo. The helpers are good. They also hide the exact things I was trying to learn.
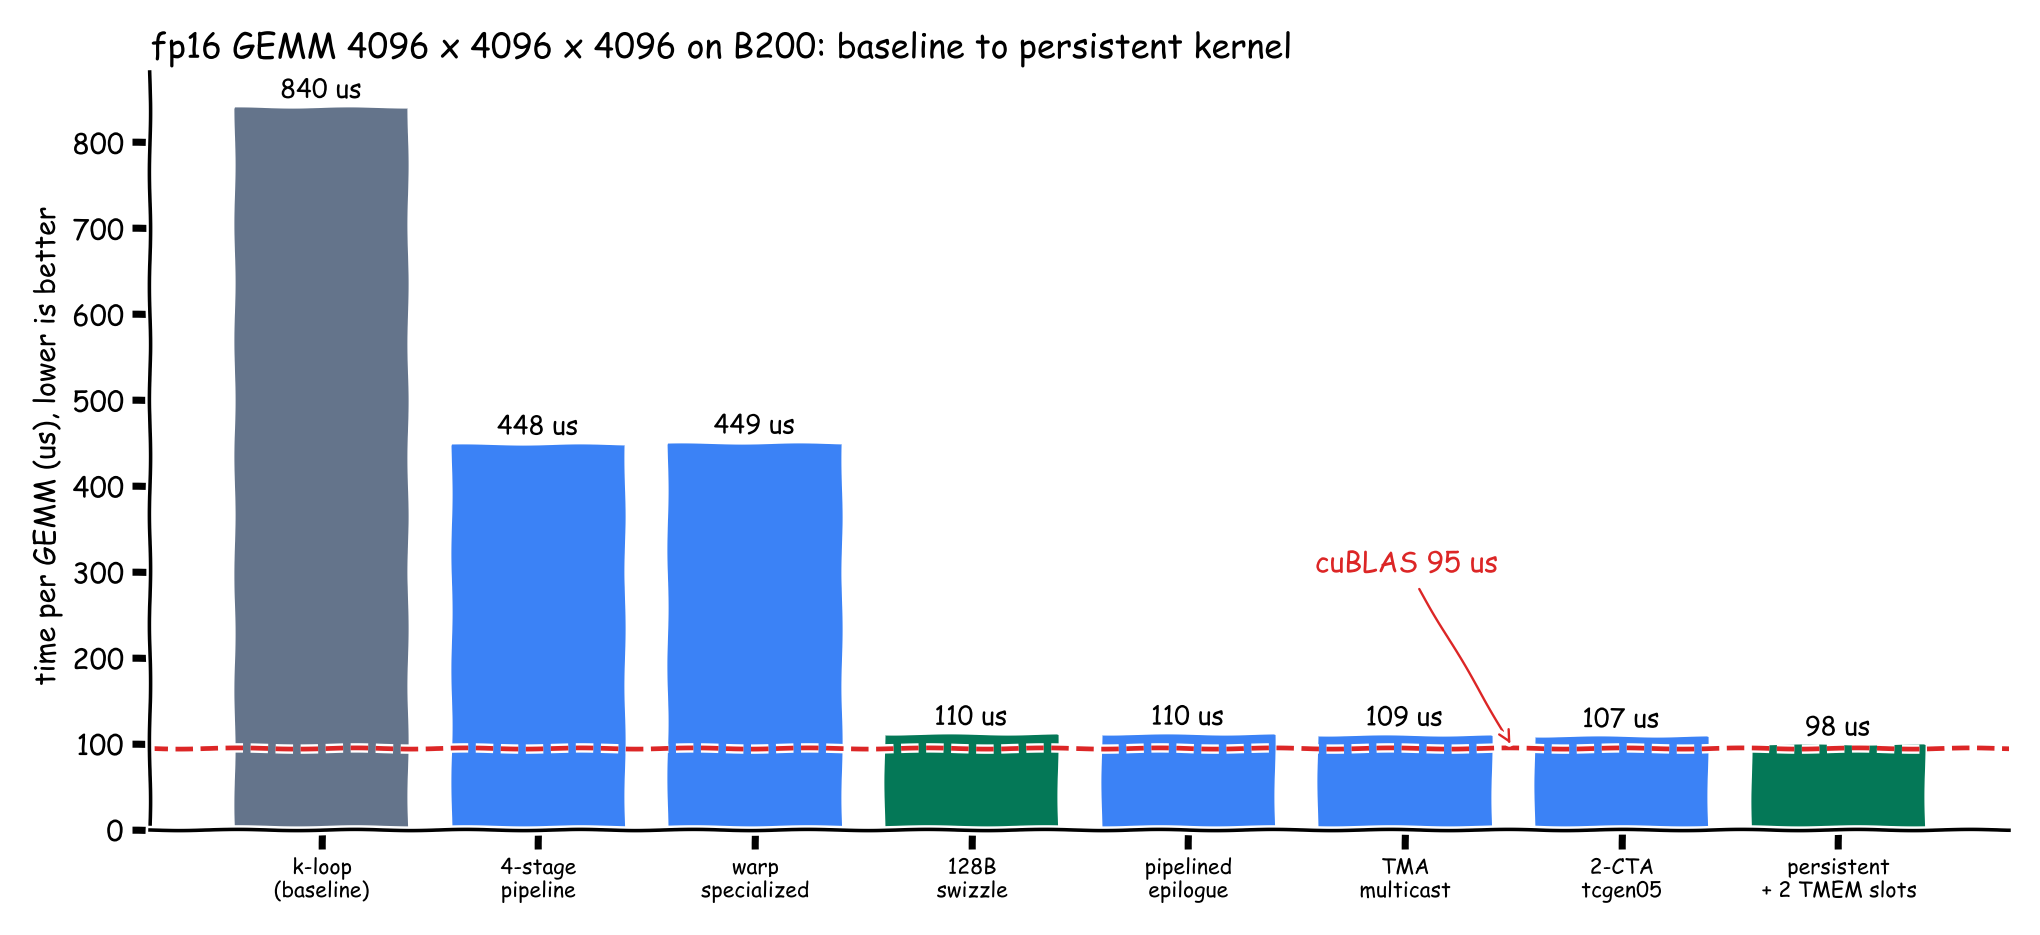
The first version that computed a correct GEMM ran at 164 TFLOP/s, 11% of cuBLAS. The last one runs at 1401 TFLOP/s on a 4096 cubed problem, 97% of cuBLAS. Eight changes got it there. The list of changes is the boring part. The interesting part is that three of them did nothing, one of them did almost all the work, and which change matters depends on whether you are running prefill or decode.
ps: The experiments in this are fully done by Claude, not me.
Two workloads, not one
Most GEMM write-ups benchmark square matrices, which says little about what an inference server runs. When N and K are large, a GEMM does about M FLOPs per byte of memory traffic, and that one number decides what limits the kernel. In prefill M is thousands of prompt tokens, so the tensor cores are the limit. In decode M is the batch size, tens to a couple hundred, and at M=256 the kernel does about 250 FLOP/B, right at the crossover of roughly 200 (cuBLAS peaks near 1500 TFLOP/s and HBM near 7.7 TB/s here).
I took N and K from the linear layers of Llama 3 70B. Prefill uses M=8192 with the attention output (N=8192, K=8192) and MLP up (N=28672, K=8192) projections. Decode uses M=256 with attention output, fused QKV (N=10240, K=8192), MLP up and MLP down (N=8192, K=28672). I also kept 4096 cubed as the familiar reference, and profiled it with Nsight Compute at every step, and the other shapes for a subset of the versions.
One limitation: the final kernel needs M to be a multiple of 256, because a CTA pair covers 256 rows. Real decode batches are often 1 to 64, where cuBLAS takes 23 to 24 us on an 8192 by 8192 weight and my kernel would pad to 256 and take about 48 us. So the decode numbers here are for the smallest M my kernel supports.
How I measured
Timing uses CUDA events around 20 to 50 iterations, and torch.matmul runs on the same tensors in the same process on the same GPU. On fp16 CUDA tensors that goes to cuBLAS. Repeat runs of the same kernel vary by about 1.7 us, so anything under 2% is noise, and I report those changes as no change.
Time alone hides too much, so I also profiled with Nsight Compute: duration, tensor pipe utilization, DRAM throughput, L1/TEX throughput, L2 hit rate, waves per SM, and the warp stall breakdown. An earlier draft of this post said ncu does not work on Modal's B200. It does, with --clock-control none, because the container cannot lock GPU clocks. That means the reports carry a warning about unfixed clocks. I compare percentages across versions of the kernel and do not treat them as absolute.
Every run checks the output against torch. The maximum error is 0 on every shape except MLP down, where it is 0.5 for all eight versions, so that comes from accumulating K=28672 in fp16 and not from any particular change.
Four things you need before the ladder
TMA
TMA, the Tensor Memory Accelerator, arrived with Hopper. One thread hands the hardware a descriptor and a set of coordinates, and the hardware copies a whole tile between global memory and shared memory by itself. Two consequences matter here. The copy is asynchronous, so the issuing warp moves on immediately. And the address arithmetic (strides, bounds, edge predication) lives in the descriptor, so threads do not burn registers on it.
There are loads, which go from GMEM to SMEM, and stores, which go the other way. A load is synchronized with an mbarrier. A store needs a proxy fence before it, because ordinary threads wrote the data and TMA reads it through a different path called the async proxy.
mbarrier
__syncthreads() means every thread in the block stops here until all have arrived. That is useless for TMA. One thread issues the copy and the bytes land later, written by the TMA unit, so no thread knows when. All the threads can pass a __syncthreads() while the data is still in flight.
An mbarrier is a 64-bit object in shared memory that counts both threads and bytes. It holds an expected arrival count (1 for a single producer thread, 128 for a warpgroup), a pending arrival count that each arrive decrements, a transaction count of bytes still expected, and a phase bit. When arrivals reach zero and the transaction count reaches zero, the phase bit flips, the counts reset, and every waiter is released. Waiters do not wait for a value, they wait for the phase to change, which is why every wait call takes a phase argument.
The protocol is short. The producer arrives and says how many bytes to expect, issues the TMA copy with that barrier attached, and the hardware decrements the byte count as data lands. When the last byte is in, the phase flips and the consumers wake up with a guarantee that the data is visible in shared memory.
TMEM
Tensor Memory is on-chip memory on Blackwell, separate from shared memory and from registers. Each SM has 256 KB of it, laid out as 128 lanes by 512 columns of 32-bit cells. An fp32 accumulator tile of 128 by N takes N columns.
On Hopper, wgmma kept accumulators in registers. That ate most of the register file and capped the tile size, forced a whole warpgroup to own the MMA, and made the epilogue fight the mainloop for the same registers. Blackwell moves the accumulator into TMEM. The tensor core owns the result, one thread can issue the MMA, and registers stay free.
You use it like malloc. One warp calls tcgen05.alloc for a power-of-two number of columns, at least 32, and frees it at the end. The MMA warp issues tcgen05.mma pointing at the TMEM address, and tcgen05.commit plus an mbarrier signals that the accumulator is done. The epilogue warps read it back with tcgen05.ld, 32 lanes per warp, convert, and write to global memory, usually through shared memory and a TMA store.
Persistent kernels
I explain this one where it shows up, at the last step, because the reason for it only makes sense after seeing the profile that motivated it.
The starting point (PR #3)
The kernel before the first step is small. Each CTA loads one MMA tile of A and B from global memory into shared memory through cute.copy() behind an mbarrier, issues one UMMA through cute.gemm(), and writes the accumulator out. K is fixed at 16, one MMA instruction deep, so it is not yet a general GEMM. Two mbarriers, each used once, so every wait is at phase 0. The shared memory layout is plain and the epilogue is serial.
Its profile already contains a lesson. Warps spend 19.5 of every 40.1 cycles between issued instructions stalled on an L1TEX scoreboard dependency, 48.8% of the total. I first read that as memory latency. It is not. An mbarrier wait is a poll on a shared memory address, and shared memory access goes through the L1TEX pipe, so "stalled on L1TEX" here just means threads sitting at the two mbarrier_wait calls while the TMA unit and the tensor core do their work. The kernel has no other work to give those threads. Everyone stalls at once. That is a problem of overlap, and the first two steps are about creating something to overlap.
Step 1: the K-loop (the baseline) (PR #4)
Each CTA did exactly one MMA, which only works when K fits in a single tile of 16. This step walks K in chunks of 16, does one MMA per chunk, and accumulates into the same TMEM tile. The first MMA has to overwrite the accumulator and every later one has to add, and cute.gemm does not toggle that for you.
This is not an optimization. It is the first version that is a real GEMM, and everything else is measured against it. With one buffer the loop is strictly load, wait, MMA, wait, about 950 ns per K-step to move 12 KiB and issue one MMA. The mbarriers are now reused every iteration, so the phase alternates 0, 1, 0, 1, and getting that wrong hangs on iteration 1.
The profile shows a new stall. Cycles between issued instructions jump from 40 to 167.6, and 73.8% of that (123.7 cycles) is warps waiting at a CTA barrier for their siblings. The whole loop sits under if warp_idx == 0, so warps 1 to 3 do nothing while warp 0 runs all 256 iterations. Tensor pipe utilization is 7.5%, and more overlap in warp 0's loop was the cheaper fix, so that came first.
After every step I re-timed four shapes: 4096 cubed, prefill MLP up (M=8192, N=28672, K=8192), decode attention output (M=256, N=8192, K=8192) and decode MLP up (M=256, N=28672, K=8192). The table shows the time and the speed relative to cuBLAS.
| Shape | Time | vs cuBLAS |
|---|---|---|
| 4096 cubed | 840 us | 0.11x |
| prefill MLP up (8192, 28672, 8192) | 20962 us | 0.11x |
| decode attention output (256, 8192, 8192) | 450 us | 0.07x |
| decode MLP up (256, 28672, 8192) | 873 us | 0.13x |
Step 2: a 4-stage pipeline (PR #5)
num_stages is the number of shared memory buffers, and it does not split K. With K=4096 and a tile of 16 the loop still runs 256 times while four buffers rotate underneath it. The kernel loads tiles 0 to 3 up front, then iteration k waits on its slot, issues the MMA, and refills that slot with tile k+4. The MMAs still run one after another because they accumulate into the same TMEM tile, so only the loads overlap.
Each barrier is now reused once per lap around the ring, so the load phase flips when the stage index wraps while the MMA-done phase still flips every iteration. At 4096 cubed this is 1.87x faster (840 to 448 us), 1.95x on the prefill shape and 1.93x on decode MLP up. Overlapping loads with math helps at every shape.
Cycles per issued instruction fall from 167.6 to 59.6, but L1/TEX throughput jumps to 98.9% while DRAM sits at 2.3% and the L2 hit rate at 95.6%. A pipe that busy with almost no bytes coming from HBM is handling a lot of separate requests, not a lot of data. Small, badly distributed shared memory accesses look exactly like this. I filed it as a bank conflict suspect and moved on to the barrier stall.
| Shape | Time | vs cuBLAS |
|---|---|---|
| 4096 cubed | 448 us | 0.21x |
| prefill MLP up (8192, 28672, 8192) | 10686 us | 0.23x |
| decode attention output (256, 8192, 8192) | 222 us | 0.15x |
| decode MLP up (256, 28672, 8192) | 453 us | 0.24x |
Step 3: warp specialization (no change) (PR #7)
The CTA barrier stall was still 43 cycles, with warps 1 to 3 idle while warp 0 did everything in sequence. So warp 0 became a producer that waits for an empty slot and issues TMA, and warp 1 became a consumer that waits for a full slot, issues the MMA and commits to an empty barrier. The barriers are pre-armed at init, so the producer's first lap does not block and the prologue disappears. Warps 2 and 3 idle until the epilogue.
Result: 449 us against 448, nothing, and the prefill and decode shapes did not move either. The profile shows the change did what I asked, since the CTA barrier stall fell from 43.3 to 37.1 cycles. It did not matter because L1/TEX was already the binding constraint at 98%, so shaving idle time off warps 2 and 3 cannot speed up warps 0 and 1.
I had also misjudged what specialization removes. It removes issue serialization, but cute.copy, cute.gemm and tcgen05.commit are all asynchronous, so the single warp in step 2 was never stuck issuing. It was stuck waiting for data, and two warps just wait for the same data. I kept the change because the per-stage full and empty barrier pair is needed later, and this null result forced me to stop reasoning from the code and start removing pieces of the kernel.
| Shape | Time | vs cuBLAS |
|---|---|---|
| 4096 cubed | 449 us | 0.21x |
| prefill MLP up (8192, 28672, 8192) | 10685 us | 0.23x |
| decode attention output (256, 8192, 8192) | 222 us | 0.15x |
| decode MLP up (256, 28672, 8192) | 453 us | 0.24x |
Step 4: the 128B swizzle (almost the whole story) (PR #8)
Duration fell from 477 us to 116 us in the profile, and from 448 to 110 us in the timing run. That is 4.1x from one change. Tensor pipe utilization went from 13.7% to 63.7%. L1/TEX throughput fell from 98.8% to 68.8%. DRAM throughput rose from 2.3% to 9.4%, because data was finally arriving fast enough for HBM to matter.
These ablations followed the null at step 3. Each row removes or changes one thing, timed at 4096 cubed:
| variant | time | what it says |
|---|---|---|
| MMA chain only, no loads | 96.4 us | compute is already at cuBLAS speed (1426 TFLOP/s) |
| loads only, no MMA | 417.3 us | the load path is 92% of the runtime |
| 8 stages instead of 4 | 454.6 us | not latency-bound |
| tile_k of 64 instead of 16 (4x fewer copies) | 448.5 us | not limited by copy issue rate |
| 2 CTAs per SM | 555.0 us | worse, more concurrency hurt |
So the tensor cores were fine, the loads were the entire problem, and nothing about the pipeline changed them. That left the layout of the data in shared memory.
Shared memory is 32 banks of 4 bytes and wraps every 128 bytes. With tile_k = 64, one row of A is 64 fp16 values, exactly 128 bytes, and the row stride is also 128 bytes. So every row starts at bank 0. TMA writes many rows at once and they all pile onto the same banks in the same order, and the accesses queue up.
The swizzle cuts each 128-byte row into eight 16-byte chunks and XORs the chunk index with the row index. Row 0 keeps its chunks in order, row 1 swaps neighbours, row 2 swaps pairs, and so on. Nothing moves between rows, it is a permutation within each row, and the address math is one XOR. Reading the same logical column across eight rows now touches eight different bank groups.
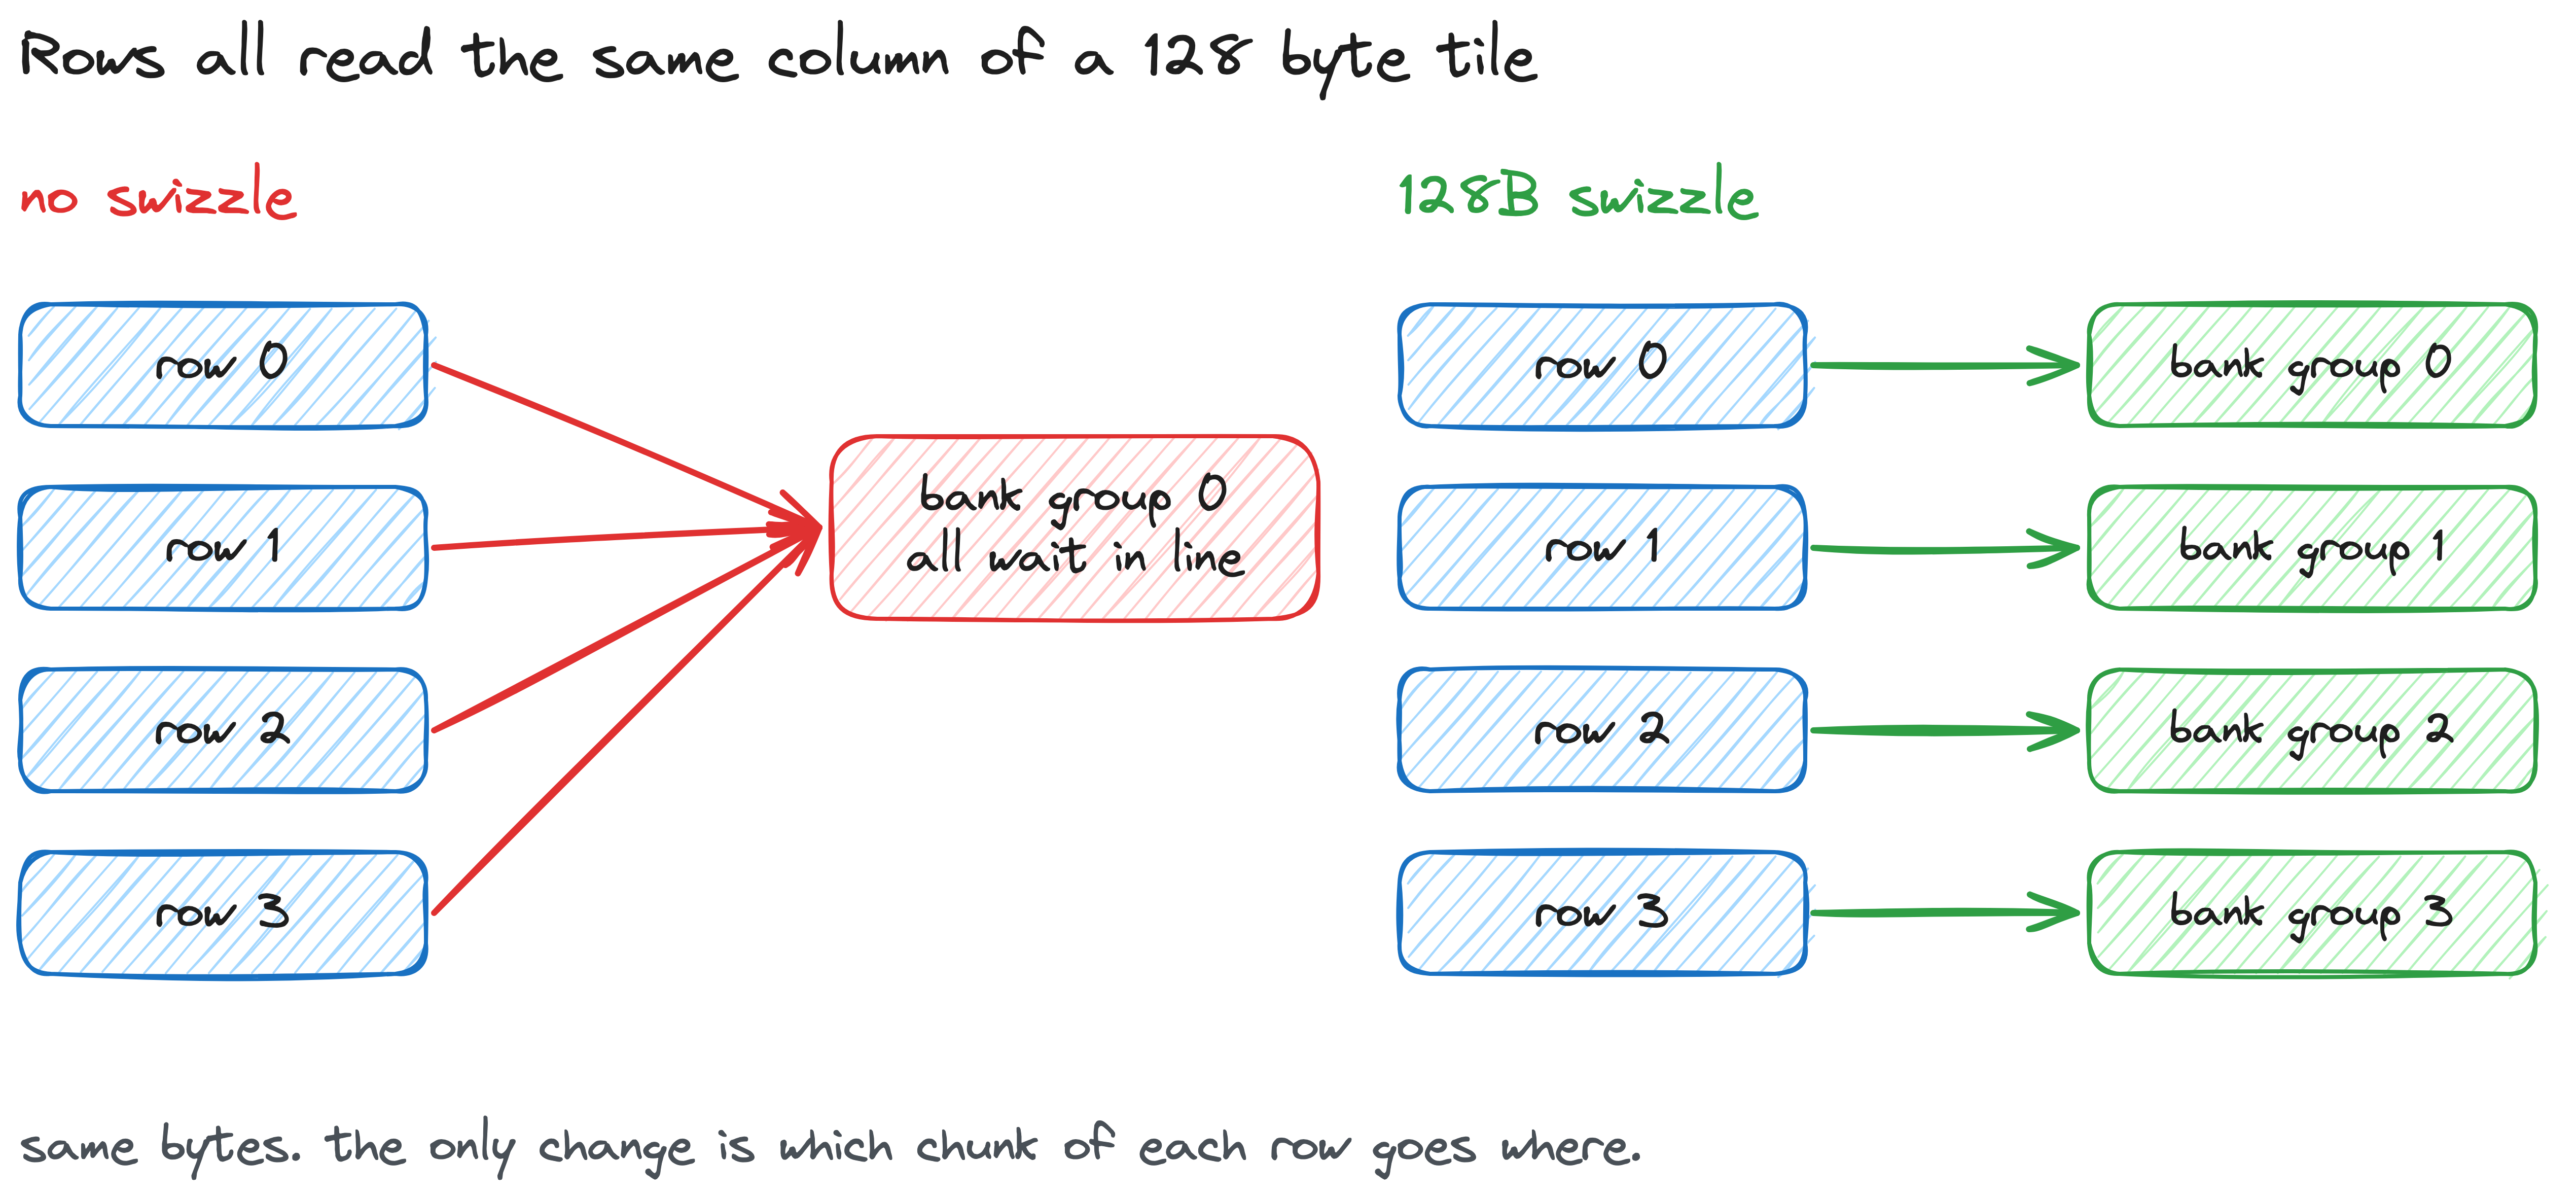
A follow-up benchmark isolated the load path with no MMA at all. Identical bytes, identical copies, only the layout differs. Without the swizzle it moved 3.85 TB/s, with it 18.5 TB/s, a 4.8x difference. A 4-way conflict predicts about 4x, so the mechanism and the size of the effect agree. The MMA reads were never the problem: the MMA-only ablation with the plain layout already ran at cuBLAS speed. The conflict was on the TMA writes.
Two details cost me time. A 128B swizzle needs tile_k >= 64, since it needs 64 contiguous fp16 values, and at tile_k = 16 the layout is rejected outright. Tile_k of 64 by itself did nothing (448.5 us in the table above). Only the two changes together work, which is why it took until step 4 to find. Each half tested alone looks like a dead end. Second, the swizzle goes on the pointer, not the layout: make_fragment_A rejects a composed layout, so the swizzle part goes to recast_ptr and the affine part carries the stage mode. The base pointer needs 1024-byte alignment.
It helps everywhere, and by about the same amount. 4.1x at 4096 cubed, 3.55x on the 8192 cubed prefill shape, 3.56x on the decode MLP-up shape. Bank conflicts on the load path do not care what M is.
| Shape | Time | vs cuBLAS |
|---|---|---|
| 4096 cubed | 110 us | 0.86x |
| prefill MLP up (8192, 28672, 8192) | 3063 us | 0.79x |
| decode attention output (256, 8192, 8192) | 54 us | 0.59x |
| decode MLP up (256, 28672, 8192) | 127 us | 0.87x |
Step 5: a pipelined epilogue (no change) (PR #9)
The epilogue moves the accumulator out in four chunks, each going TMEM to registers, then convert, then global memory. The first four versions reuse one register set for all chunks, which looks like a write-after-read hazard, so I double-buffered the registers and issued chunk i+1's read before converting chunk i. No change: three runs gave 108.8, 110.4 and 110.5 us against 109.3 before, and the profile moved from 116.2 to 112.9 us, inside the noise.
The hazard was not real. The DSL lowers to SSA, so each cute.copy yields a fresh value and the loop is fully unrolled, and ptxas had already pipelined the four independent chains. I hand-wrote something the compiler had already done.
I should have checked the size of the prize first. The whole epilogue is at most 13 us of a 109 us kernel, so a perfect version could not save more than 12%. Measuring how long a stage takes before optimizing it would have saved this step.
| Shape | Time | vs cuBLAS |
|---|---|---|
| 4096 cubed | 110 us | 0.86x |
| prefill MLP up (8192, 28672, 8192) | 3054 us | 0.79x |
| decode attention output (256, 8192, 8192) | 54 us | 0.60x |
| decode MLP up (256, 28672, 8192) | 127 us | 0.87x |
Step 6: TMA multicast (no change, and worse at 8192) (PR #10)
At 4096 cubed the grid is 32 by 16 CTAs, so the 16 CTAs that share a row each independently fetch the same A tile. Multicast lets one TMA request deliver into the shared memory of several CTAs in a cluster, so with a 2 by 2 cluster the bytes requested from L2 halve for both A and B. Thien Tran had told me this would not help, and said to draw my own conclusions.
He was right. At 4096 cubed it is 109.4 us against 110.2, decode is flat on every shape, and the 8192 cubed prefill shape got about 6% worse (918 us against 864), which I have no measured explanation for. The profile shows the mechanism works, since L1/TEX throughput drops from 68.3% to 59.2%. It was a null result because the kernel was already limited by compute, with DRAM at 9 to 10% since the swizzle.
A separate benchmark had every CTA load the same tile, which removes almost all L2 read traffic. It ran at the same speed as loading 512 different tiles (406.5 us against 403.8), so L2 traffic was not the limit and filling each CTA's own shared memory was. I kept the change because building it taught me create_tma_multicast_mask, which is how CTAs signal each other across a cluster in the next step.
| Shape | Time | vs cuBLAS |
|---|---|---|
| 4096 cubed | 109 us | 0.87x |
| prefill MLP up (8192, 28672, 8192) | 3205 us | 0.75x |
| decode attention output (256, 8192, 8192) | 55 us | 0.59x |
| decode MLP up (256, 28672, 8192) | 126 us | 0.88x |
Step 7: two CTAs per MMA (PR #11)
With CtaGroup.TWO, a pair of CTAs on neighbouring SMs issues one MMA that is 256 rows tall, and each CTA supplies half the operands and holds half the accumulator in its own TMEM. That raises the arithmetic intensity per CTA from 85 to 128 FLOP/B. I ran it with a (2, 1) cluster and no multicast, which was Simon V's suggestion, and it left exactly one new thing to debug.

The two CTAs are not symmetric, and treating them as peers is what made this the hardest step. One full barrier belongs to the leader, who alone arms it, waits on it, issues the MMA and commits, while tcgen05.commit only reaches the CTAs named in its mask. The resulting hang was found by shrinking the problem: it completed at K=192, where no stage is recycled, and hung at K=1024, because the follower's empty barrier was never signalled. Naming the peer in the commit mask fixed it.
The gain is small on the square problem, 109.4 to 107.3 us at 4096 cubed, and larger on decode: 54 to 48 us on attention output, 127 to 117 us on MLP up and 166 to 138 us on MLP down. My reading, which I did not measure, is that a pair covers all 256 rows of M and fetches the weight tile once instead of twice. The profile of this step motivated the next: nothing is above 62% utilization, occupancy is 6.25% (one block per SM, 197.6 KB of 200.7 KB shared memory), and the CTA barrier takes 54% of the stall cycles across 3.46 waves. With one block per SM nothing feeds the tensor core while a block drains, so I needed overlap, not more parallelism.
| Shape | Time | vs cuBLAS |
|---|---|---|
| 4096 cubed | 107 us | 0.88x |
| prefill MLP up (8192, 28672, 8192) | 3010 us | 0.80x |
| decode attention output (256, 8192, 8192) | 48 us | 0.68x |
| decode MLP up (256, 28672, 8192) | 117 us | 0.95x |
Step 8: a persistent kernel with a double-buffered accumulator (commit 1532b21)
A wave is the batch of thread blocks the hardware can place on all SMs at once. A normal kernel is a sequence of waves, each block computes one output tile and exits, and the hardware picks the next block. A persistent kernel launches only as many blocks as there are SMs (148 blocks here, so 74 pairs), and each block loops over tiles itself. That gives you control of the schedule, and control is what lets you overlap.
The overlap comes from TMEM. It holds 512 columns and one fp32 accumulator for a 128 by 256 tile takes 256, so exactly two fit. Call them slot 0 and slot 1. Tile i accumulates into slot i % 2. While the epilogue warps drain slot 0, the MMA warp is already running tile i+1 into slot 1. The tensor core never waits for the epilogue. It is the same trick as double-buffering the A and B tiles, applied to the output side.
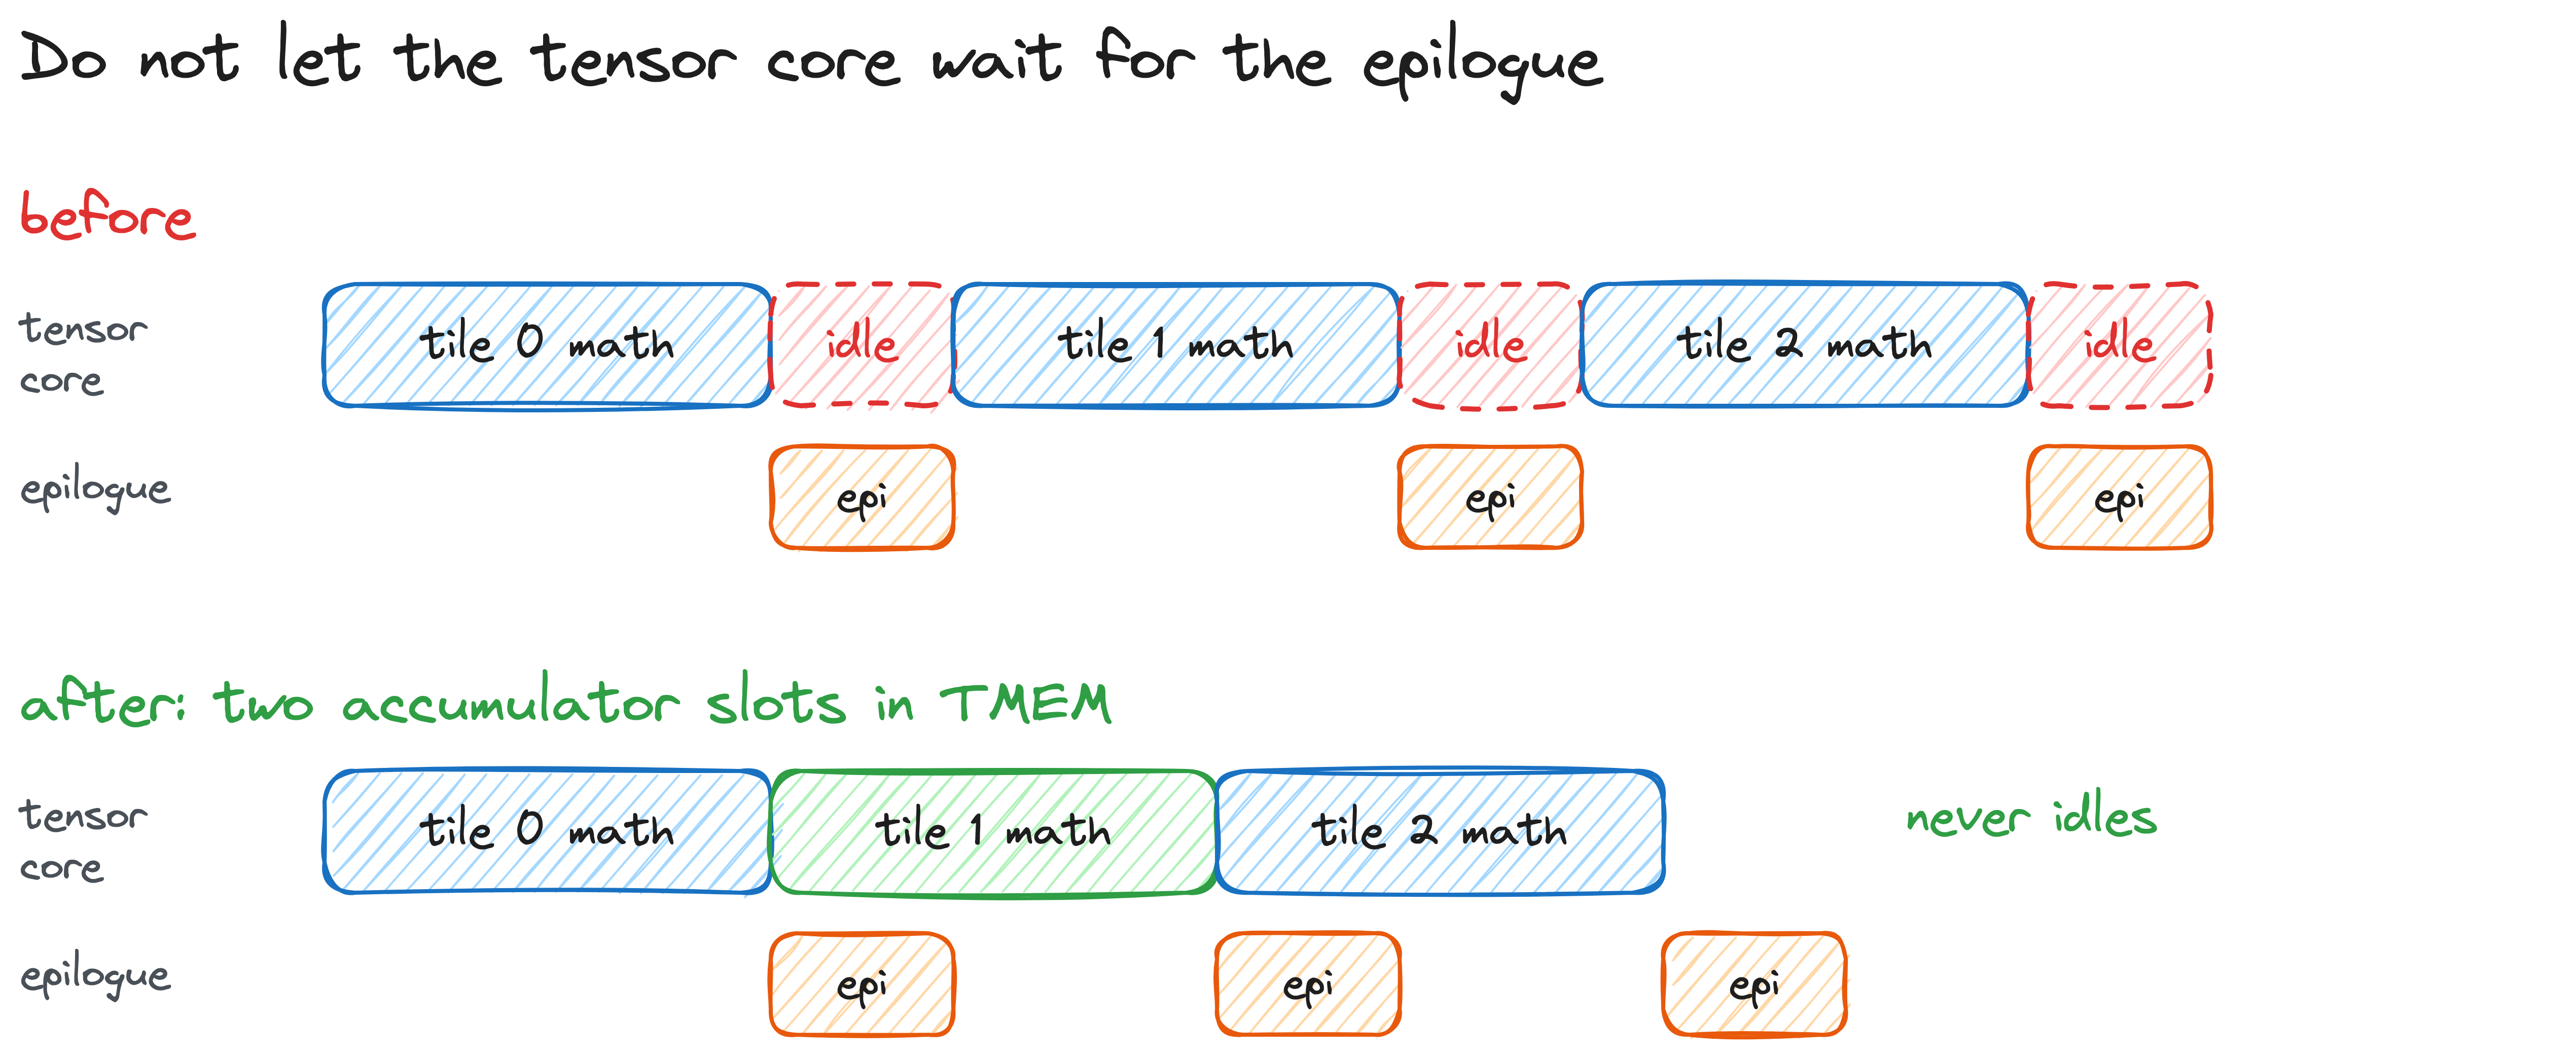
In pseudocode the MMA warp waits for acc_empty[s], runs all K blocks into slot s, and commits acc_full[s]. The epilogue warps wait for acc_full[s], read the slot out of TMEM, and release acc_empty[s] as soon as the reads finish, before converting or storing anything, so the MMA warp can reuse the slot as early as possible.
The profile agrees with the design. The grid is 148 blocks and waves per SM went from 3.46 to 1.0. Tensor pipe utilization went from 61.7% to 74.5% at 4096 cubed, and from 84.8% to 93.9% at 8192 cubed. The top stall changed from the CTA barrier (19.5 of 35.9 cycles) to L1TEX scoreboard (42.3 of 55.2 cycles). That looks worse and is not. L1TEX scoreboard here means warps waiting in mbarrier_wait, and in a warp-specialized kernel each role spends most of its time waiting for the one before it: the epilogue on acc_full, the TMA warp on ab_empty. That is the handoff working. The number to watch is how busy the tensor core is.
Timing: 107.3 to 98.0 us at 4096 cubed (1.09x), 848 to 816 us at 8192 cubed, 1401 TFLOP/s on the square problem.
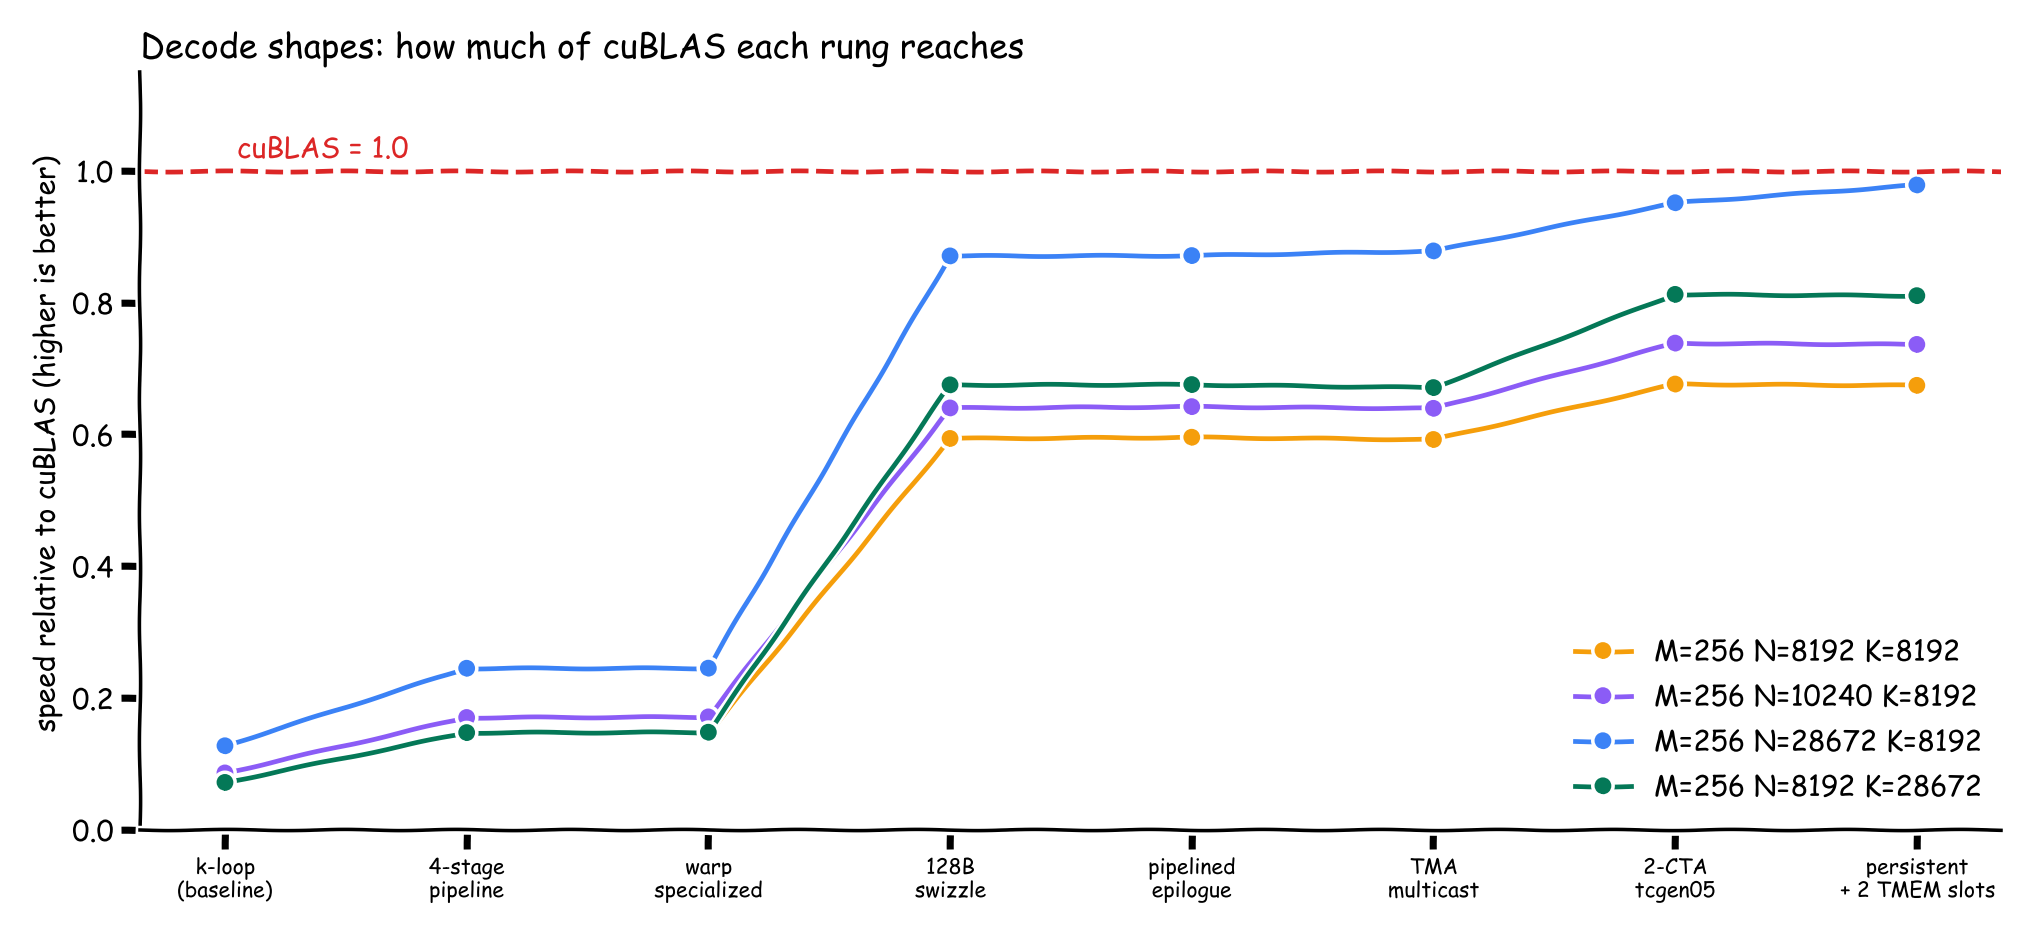
There are limits. The two slots have to fit in 512 columns, so N is at most 256 per slot. The epilogue is only completely hidden if it is shorter than the mainloop, which fails for small K. And the first tile's mainloop and the last tile's epilogue cannot overlap with anything, so that cost is only amortized over the tiles a block handles. On decode this step does close to nothing, and the next section shows why.
| Shape | Time | vs cuBLAS |
|---|---|---|
| 4096 cubed | 98 us | 0.97x |
| prefill MLP up (8192, 28672, 8192) | 2934 us | 0.82x |
| decode attention output (256, 8192, 8192) | 48 us | 0.67x |
| decode MLP up (256, 28672, 8192) | 113 us | 0.98x |
Putting it together
The Nsight Compute numbers at 4096 cubed tell the whole project in a few lines. Tensor pipe utilization sits at 7% to 14% for the first three steps while L1/TEX throughput climbs to 99%. The pipe is busy and the tensor core is starved. Then the swizzle lands, L1/TEX drops to 69% and tensor utilization jumps to 64%. Nothing else moves it until the persistent kernel at the end, which takes it to 75%. Steps 5 and 6 barely register on any counter. DRAM stays at 2% to 11% the whole way, because at 4096 cubed almost everything is served from L2.
When each change helps
| Change | Prefill (M=8192) | Decode (M=256) | Why |
|---|---|---|---|
| 4-stage pipeline | 1.95x | 1.9x | hides load latency at any shape |
| Warp specialization | no change | no change | the bottleneck was the load path, not issue |
| 128B swizzle | 3.55x | 3.56x | TMA write conflicts do not depend on M |
| Pipelined epilogue | no change | no change | compiler already did it, epilogue is 12% at most |
| TMA multicast | 6% slower | no change | not L2 bound, and multicast couples the CTAs |
| 2 CTAs per MMA | 1.02x | 1.1x to 1.2x | halves weight traffic per CTA |
| Persistent + 2 TMEM slots | 1.03x to 1.09x | 1.0x to 1.03x | needs more than one tile per block to overlap |
The ratios are between neighbouring steps, taken from the 8192 cubed and MLP-up shapes for prefill and the four M=256 shapes for decode. The 2-CTA prefill figure compares against the last kernel before multicast. All shapes are in results/rung_sweep.json.
Against cuBLAS
The final kernel against cuBLAS:
| Shape | ours (us) | cuBLAS (us) | ratio |
|---|---|---|---|
| 4096 cubed | 98.0 | 94.9 | 0.97 |
| prefill, attention output (8192, 8192, 8192) | 816 | 741 | 0.91 |
| prefill, MLP up (8192, 28672, 8192) | 2934 | 2407 | 0.82 |
| decode, MLP up (256, 28672, 8192) | 113 | 111 | 0.98 |
| decode, MLP down (256, 8192, 28672) | 138 | 112 | 0.81 |
| decode, fused QKV (256, 10240, 8192) | 52 | 38 | 0.74 |
| decode, attention output (256, 8192, 8192) | 48 | 32 | 0.67 |
Decode MLP up is close to a tie. The kernel reads 478 MB from HBM, almost exactly the size of the weight matrix, so every weight is read once, and it runs at 60.6% of peak DRAM throughput with the tensor pipe 59.6% busy across all 148 SMs.
Decode attention output is the worst. Its grid is only 64 CTAs (0.43 waves on 148 SMs), so more than half the machine is idle, and it reaches 3.0 TB/s where cuBLAS reaches 4.4. A persistent kernel cannot help with less than one tile per block, which matches 47 us before and after, so smaller tiles or splitting K are the obvious things to try. The prefill MLP up gap (0.82x) is the largest on the prefill side and I have not investigated it.
Experiments
The one-off ablations were throwaway edits of whatever kernel was current. The sweeps have runnable versions in experiments/. Everything is B200, fp16, checked against torch.
The stage count, revisited
Elliot Arledge asked whether I re-swept the stage count at the end to see if 4 was still the best.

I had not, and it was worth doing. At step 3 the sweep from 4 to 8 to 12 stages was completely flat, 451.7, 454.6 and 454.1 us, which is what told me the kernel was not latency-bound. Since then the tile depth went from 16 to 64, the swizzle landed, and two CTAs halved the operand size. Shared memory per stage went from 12 KiB to 32 KiB, so the whole tradeoff moved. On the step 7 kernel:
| stages | shared memory | 4096 cubed | vs cuBLAS | 8192 cubed | vs cuBLAS |
|---|---|---|---|---|---|
| 2 | 64 KiB | 166.9 us | 0.57x | 1210.5 us | 0.62x |
| 3 | 96 KiB | 124.3 us | 0.77x | 958.8 us | 0.78x |
| 4 | 128 KiB | 110.5 us | 0.86x | 848.5 us | 0.88x |
| 5 | 160 KiB | 105.9 us | 0.90x | 858.9 us | 0.87x |
| 6 | 192 KiB | 106.2 us | 0.90x | 843.5 us | 0.89x |
| 7 | 224 KiB | 106.8 us | 0.89x | 858.7 us | 0.87x |
Four is not the best any more. It saturates at five. The kernel ships with six, which happens to be within noise of the best at both sizes, though I got lucky and did not measure my way there. The bigger point is that the same knob gave opposite conclusions at two points in the project, because the bottleneck moved in between. A sweep is only valid in the regime you ran it in.
Threadblock swizzle
subho ghosh suggested threadblock swizzle or CLC as the last pieces.

The tile walk order changes so that neighbouring CTAs share B tiles in L2: instead of CTA (x, y) taking tile (x, y), walk a group of swizzle_m tiles down M before stepping along N. On the step 7 kernel at 8192 cubed:
| swizzle_m | time | vs cuBLAS |
|---|---|---|
| 1 | 848.2 us | 0.87x |
| 4 | 803.0 us | 0.92x |
| 8 | 785.6 us | 0.94x |
| 16 | 802.8 us | 0.92x |
| 32 | 846.6 us | 0.87x |
Groups of 8 are a real optimum, since taller groups stop sharing B tiles. On a 4096 by 4096 by 16384 problem it reached 1.00x of cuBLAS, the first time anything I wrote matched it. It does nothing at 4096 cubed, where there are 256 tiles over 148 SMs and not enough waves for ordering to matter. It assumes the number of tile rows is divisible by the group size. Break that and CTAs walk off the end of M, and a run at swizzle_m=32 on a 4096 problem reported a fake 1.13x with a max error of 772. The runner now flags those combinations. I have not merged this into the persistent kernel.
As always, happy to chat if anything here is unclear or wrong. Just ping me on Twitter and the code is stored here.

 点赞
点赞 收藏
收藏 点踩
点踩 分享
分享