Business Conditions Monthly July 2026

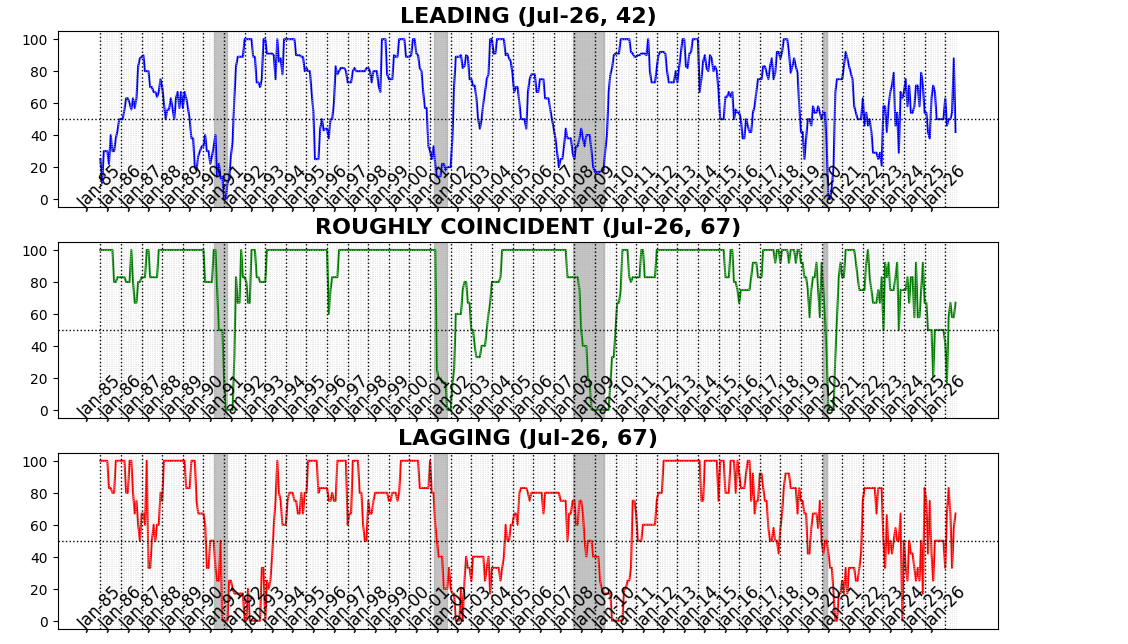
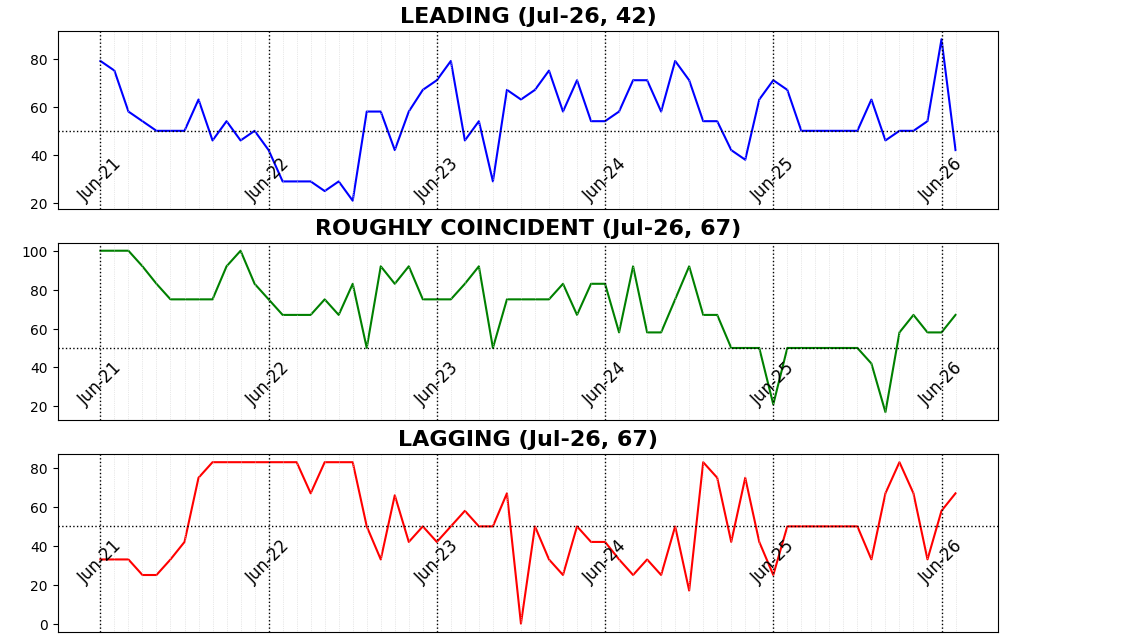
The July 2026 AIER Business Conditions Monthly (BCM) shows a sharp reversal in forward-looking conditions, even as measures of current and trailing activity improved. The Leading Indicator fell to 42 from 88 in June, with weakness concentrated in housing, retail activity, transportation, capital-goods orders, margin borrowing, and the yield-spread signal. The Roughly Coincident Indicator rose to 67 from 58, suggesting that current economic activity broadened modestly across sales, income, production, and payroll employment. The Lagging Indicator also increased to 67 from 58 as unemployment duration, commercial and industrial lending, inventories, and nonresidential construction contributed positively.
AIER Business Conditions Monthly Indicators – All Time
AIER Business Conditions Monthly Indicators – Five years
LEADING INDICATOR (42)
The Leading Indicator dropped sharply to 42, with four of 12 components improving, two unchanged, and six declining.
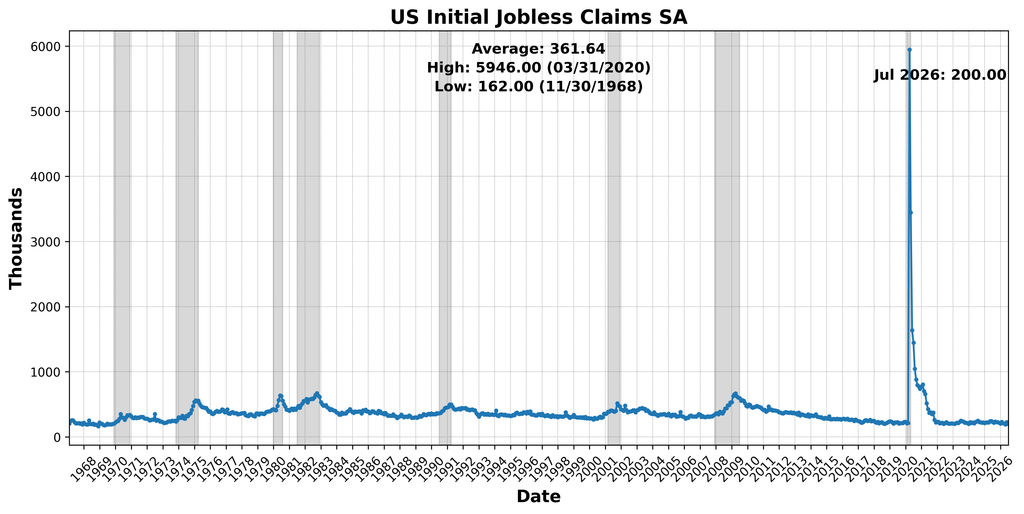
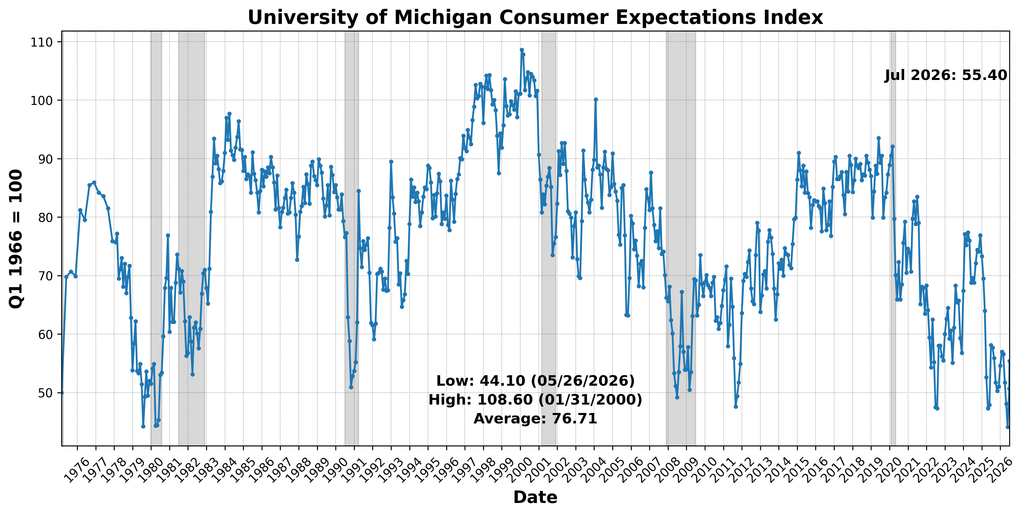
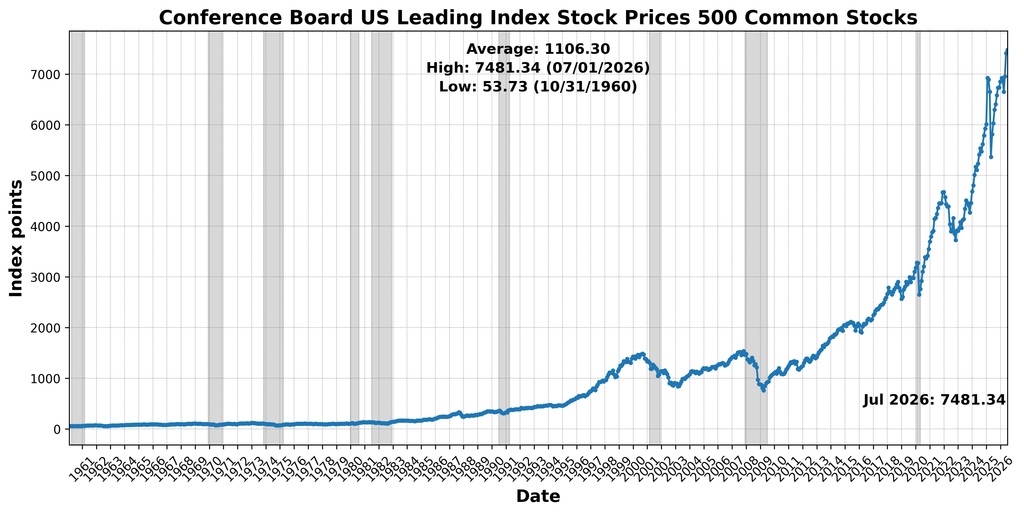
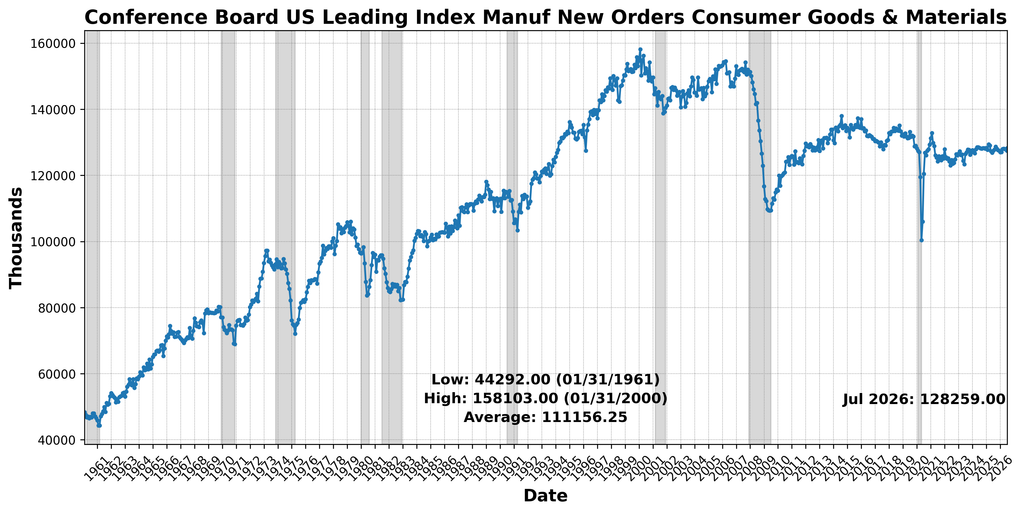
The positive components were concentrated in consumer expectations, initial claims, consumer-goods orders, and equity prices. The University of Michigan Consumer Expectations Index increased 9.3 percent, rising from 50.7 to 55.4 and extending the improvement recorded in June. US Initial Jobless Claims SA declined 7.8 percent, from 217,000 to 200,000, and contributed positively because lower claims indicate improving labor-market conditions. Conference Board US Leading Index Manufacturers’ New Orders Consumer Goods and Materials rose 0.5 percent, while the Conference Board US Leading Index Stock Prices 500 Common Stocks increased 0.4 percent.
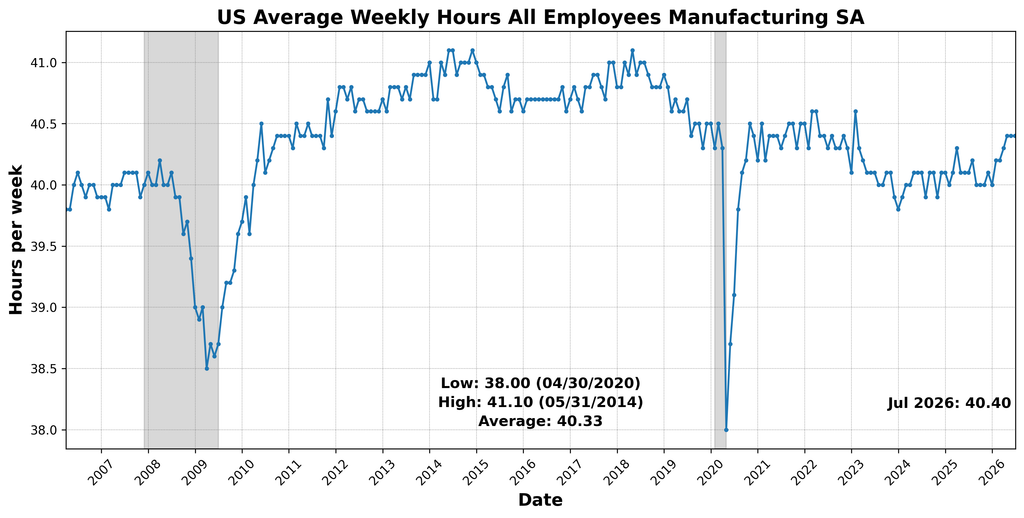
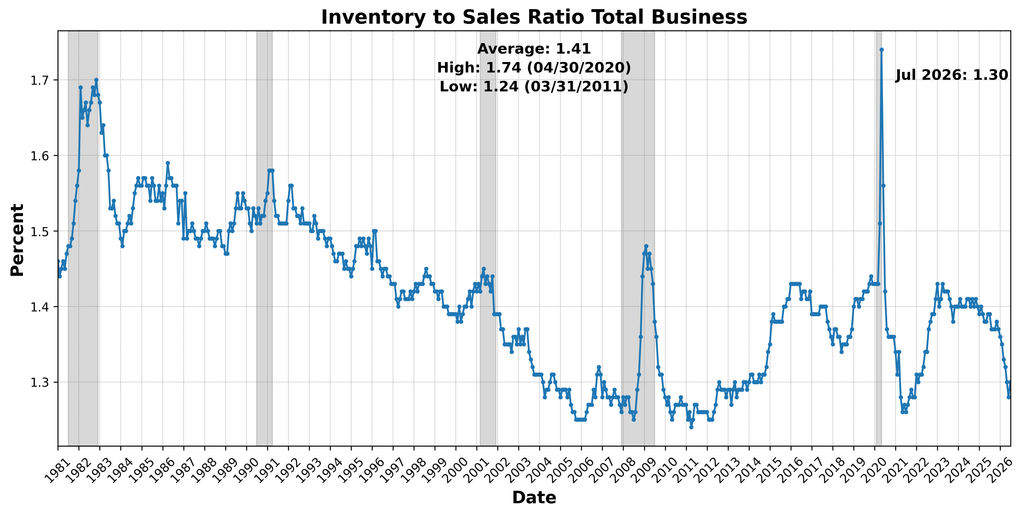
Two measures were unchanged. US Average Weekly Hours All Employees Manufacturing SA remained at 40.4 hours, while the Inventory-to-Sales Ratio Total Business held at 1.3. Both therefore contributed neutrally to the July reading.
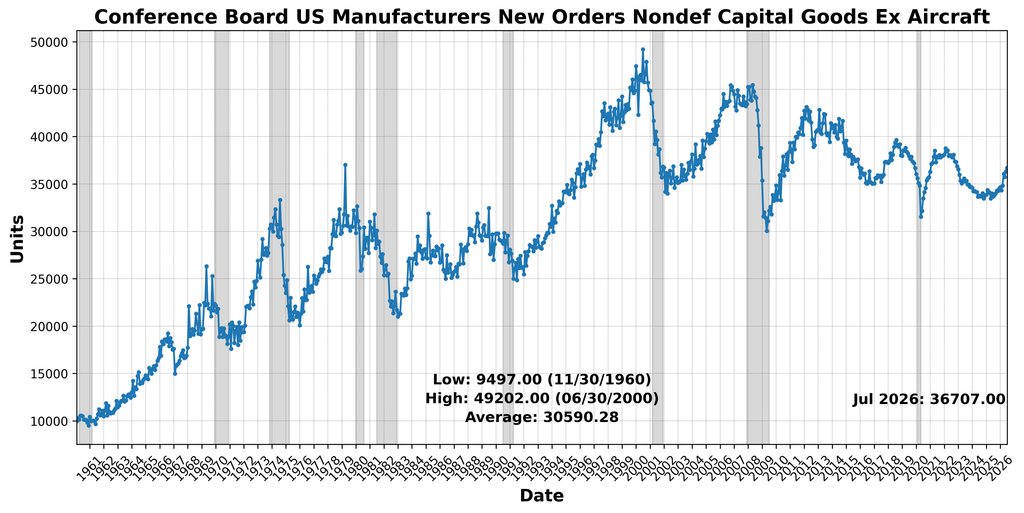
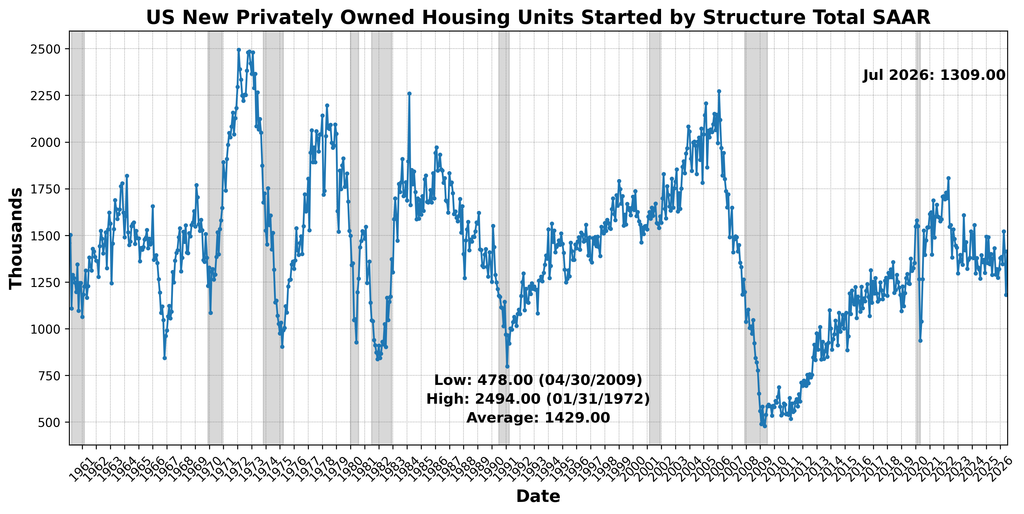
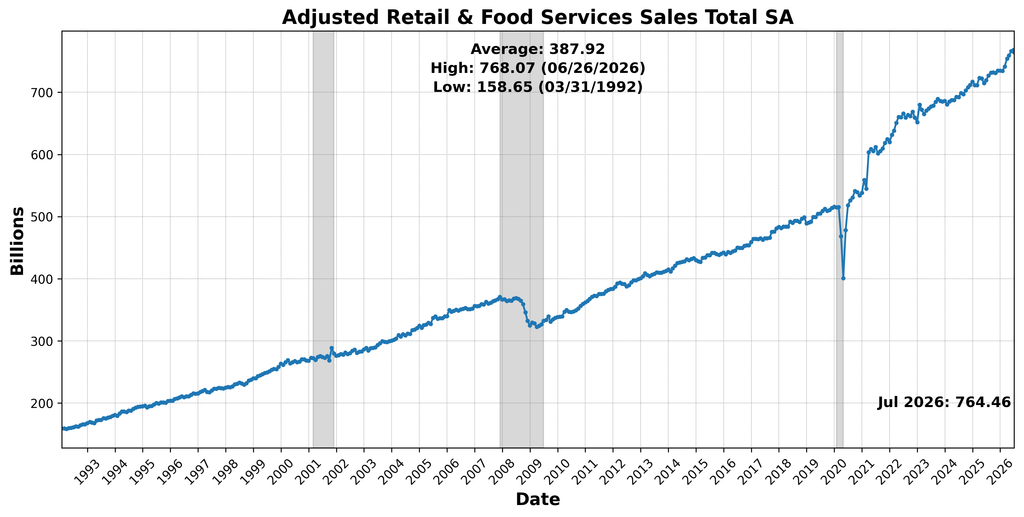
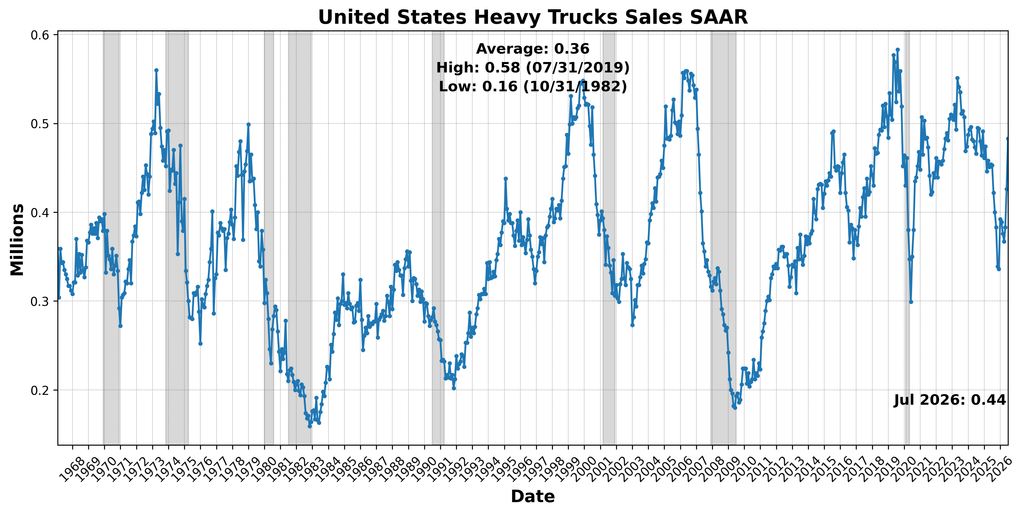
Weakness was considerably more widespread among the remaining components. Conference Board US Manufacturers New Orders Nondefense Capital Goods Ex Aircraft declined 0.4 percent, indicating some softening in a key measure of prospective business investment. US New Privately Owned Housing Units Started by Structure Total SAAR fell 9.0 percent, reversing part of June’s substantial increase. Adjusted Retail and Food Services Sales Total SA declined 0.5 percent, while United States Heavy Trucks Sales SAAR dropped 9.5 percent.
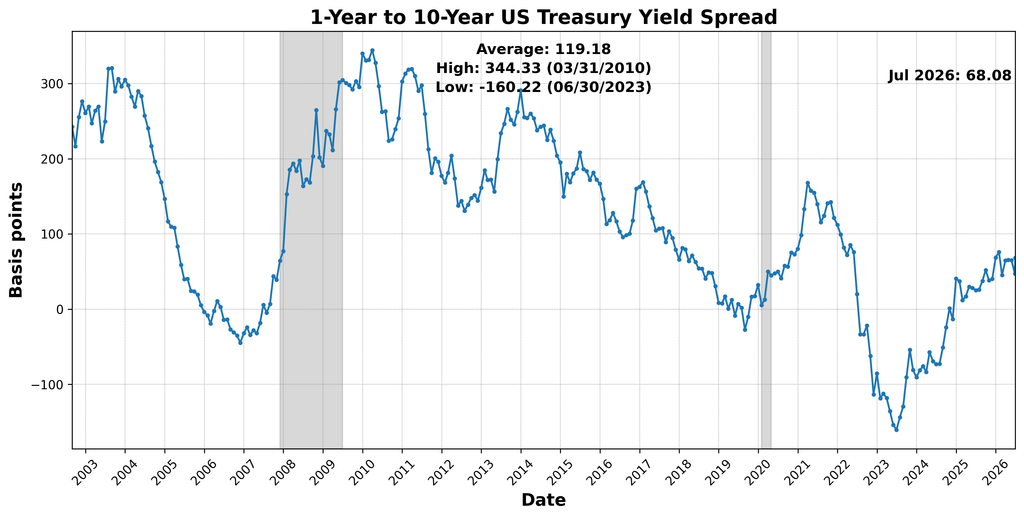
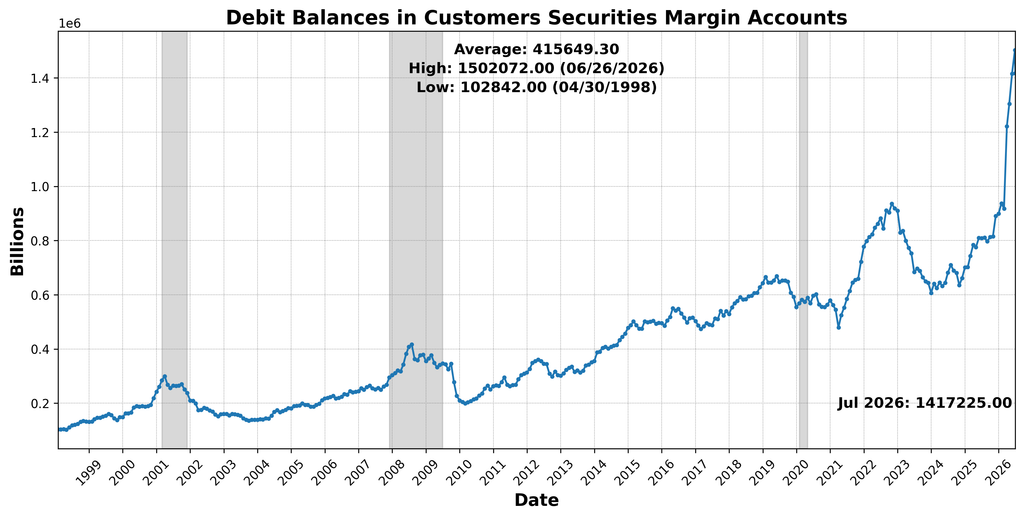
Financial measures outside equity prices were also unfavorable. Debit Balances in Customers’ Securities Margin Accounts declined 5.6 percent. The 1-Year to 10-Year US Treasury Yield Spread increased 44.4 percent; under the BCM’s inverted treatment of that measure, the increase was scored negatively.
July’s leading data represent a pronounced loss of forward-looking breadth. The decline from 88 to 42 reflects more than the normalization of June’s unusually strong reading: six components moved into the negative column, compared with only four that improved. Stronger consumer expectations, lower initial claims, firmer consumer-goods orders, and rising equity prices provided some support, but they were insufficient to offset deterioration in housing starts, retail sales, heavy truck sales, capital-goods orders, margin debt, and the yield-spread signal. One weak month does not establish a sustained downturn, but the July reading substantially tempers the optimism generated by June’s broad advance.
ROUGHLY COINCIDENT INDICATOR (67)
The Roughly Coincident Indicator rose to 67 from 58, with four of six components improving and two declining.
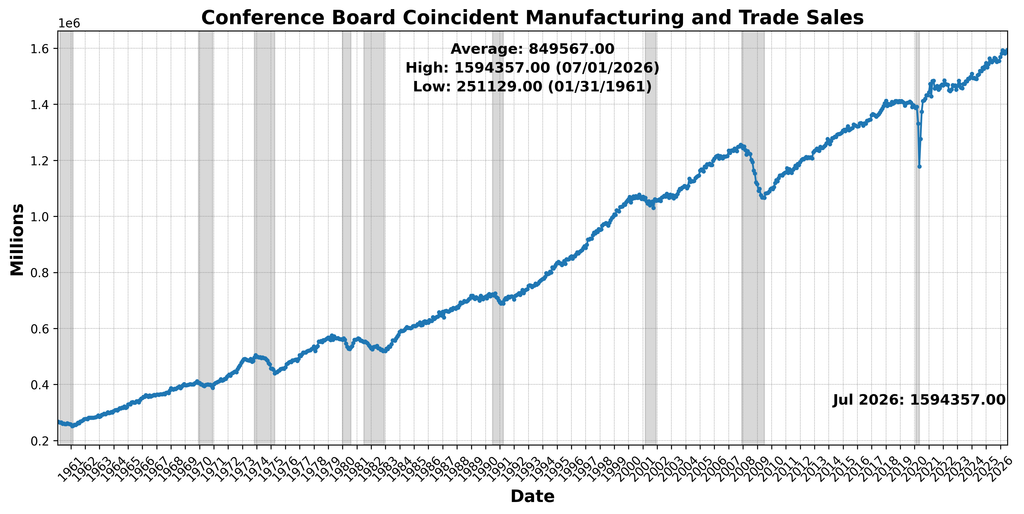
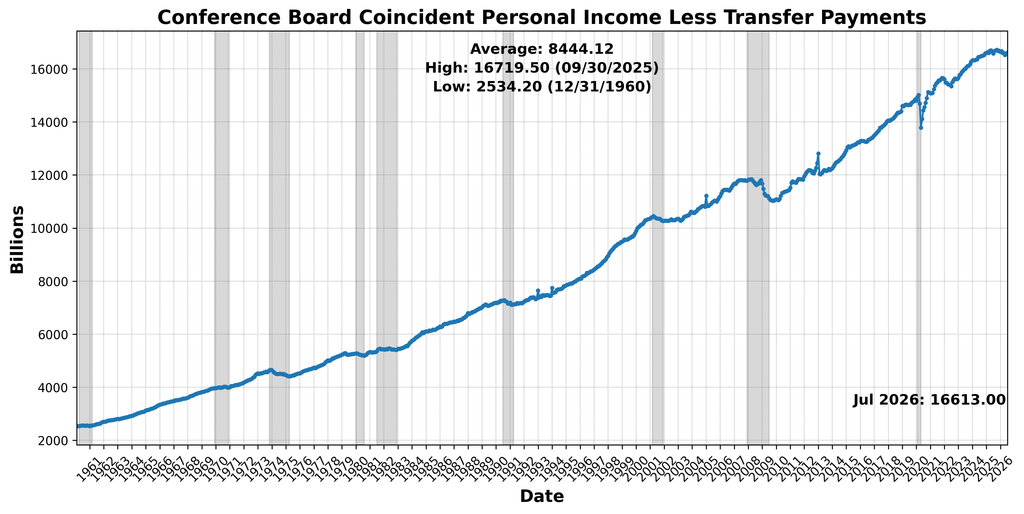
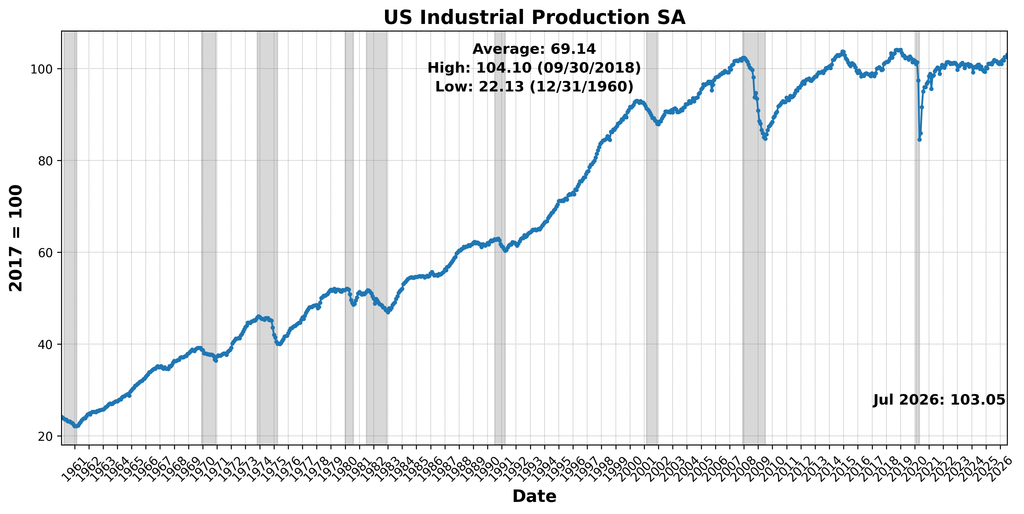
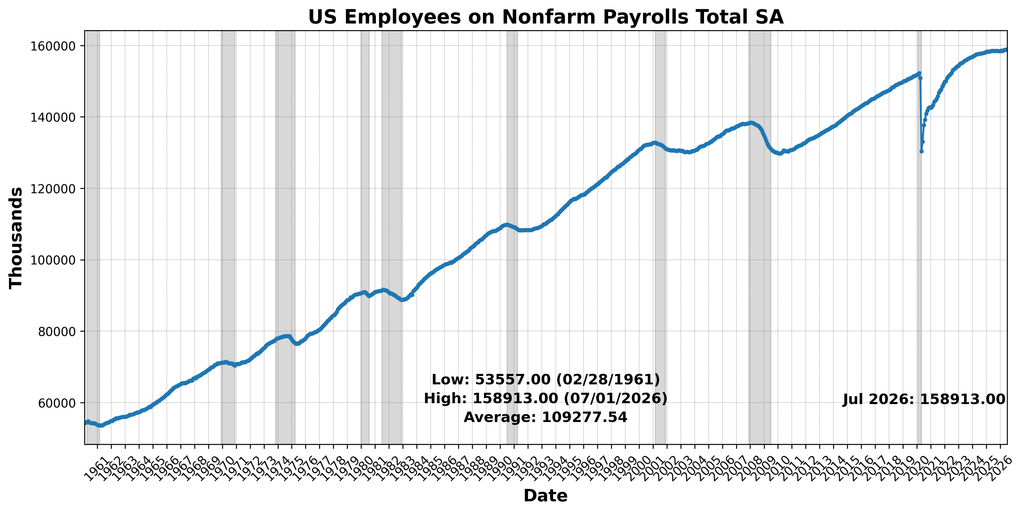
Measures of sales, income, production, and employment advanced during the month. Conference Board Coincident Manufacturing and Trade Sales increased 0.2 percent, extending June’s improvement. Conference Board Coincident Personal Income Less Transfer Payments also rose 0.2 percent. US Industrial Production SA increased 0.2 percent, while US Employees on Nonfarm Payrolls Total SA edged 0.01 percent higher. Although the payroll increase was slight, it remained positive under the BCM scoring methodology.
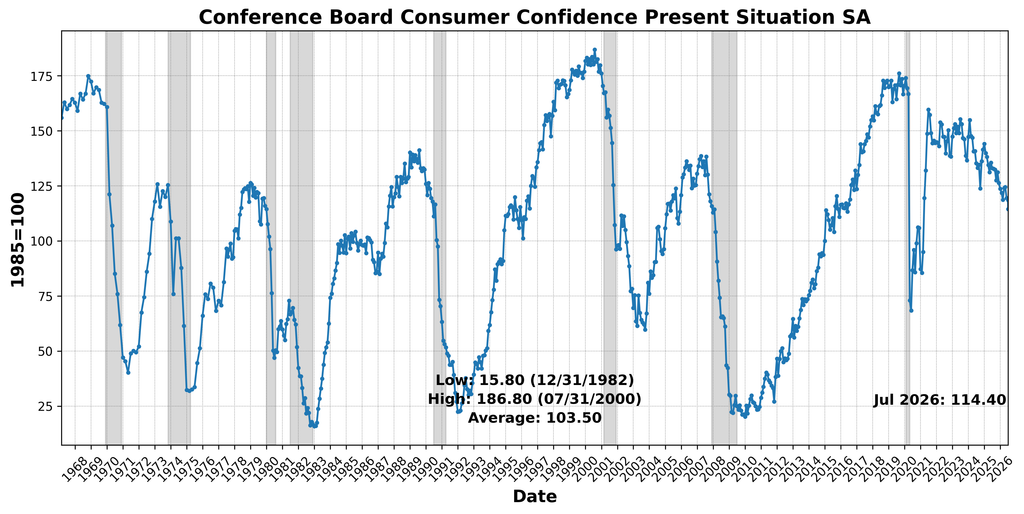
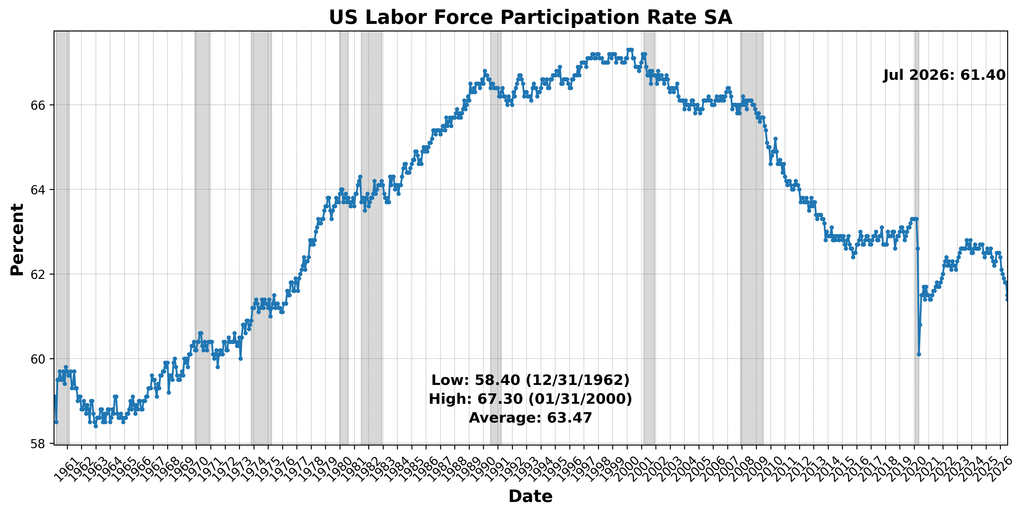
The weaker components were consumer assessments of present conditions and labor-force participation. Conference Board Consumer Confidence Present Situation SA declined 3.5 percent, falling from 118.5 to 114.4. The US Labor Force Participation Rate SA slipped from 61.5 percent to 61.4 percent, a decline of approximately 0.2 percent.
Overall, the rise in the Roughly Coincident Indicator from 58 to 67 points to a modest broadening in current economic activity. Manufacturing and trade sales, income, industrial production, and payroll employment all moved higher, giving the coincident reading greater breadth than in June. At the same time, the decline in present-situation confidence was comparatively pronounced, and the further reduction in labor-force participation points to continuing limitations in the labor market. The current-conditions picture is therefore constructive but uneven: hard measures of activity improved, while household assessments and participation weakened.
LAGGING INDICATOR (67)
The Lagging Indicator increased to 67 from 58, with four of six components improving and two declining.
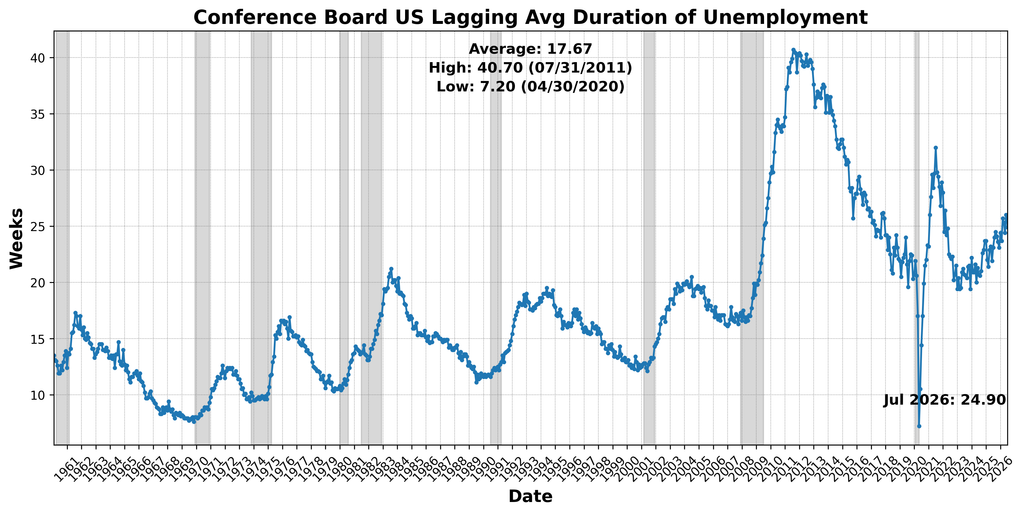
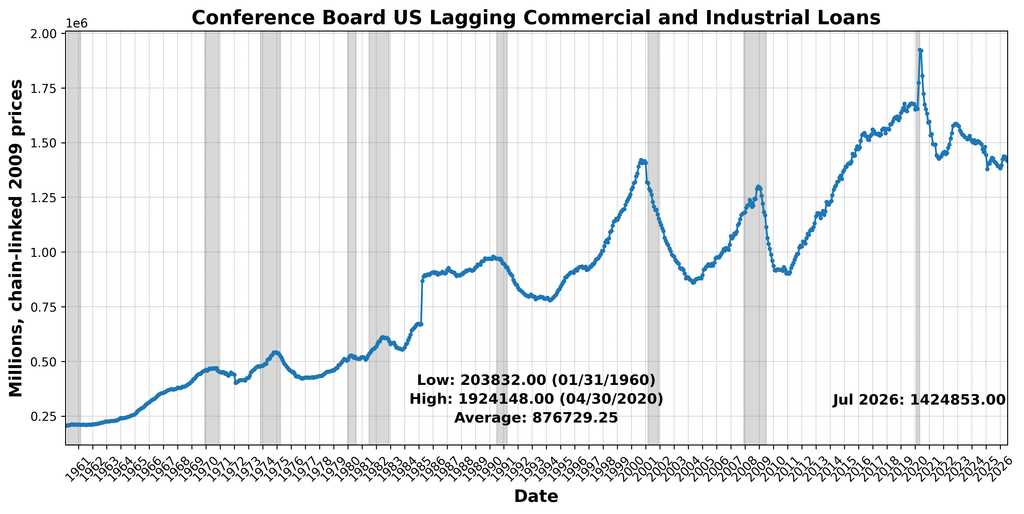
Several credit, labor-market, inventory, and construction measures contributed positively. Conference Board US Lagging Average Duration of Unemployment declined 2.4 percent, falling from 25.5 weeks to 24.9 weeks, and contributed positively because a shorter duration of unemployment represents an improvement. Conference Board US Lagging Commercial and Industrial Loans increased approximately 0.1 percent, reversing the decline recorded in June.
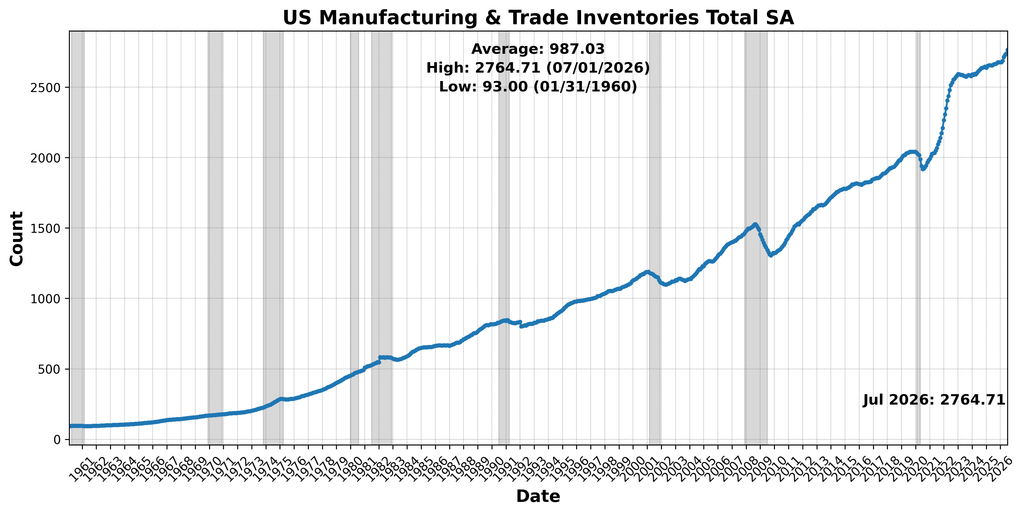
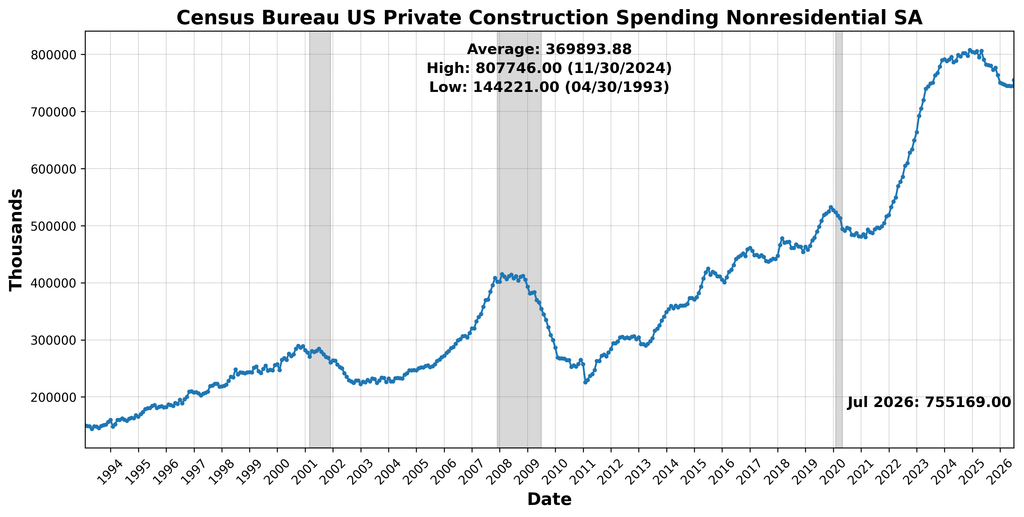
US Manufacturing and Trade Inventories Total SA rose 0.8 percent, while Census Bureau US Private Construction Spending Nonresidential SA increased 0.4 percent. Together, those movements suggest continued expansion in inventories and nonresidential investment, although neither provides a timely indication of future momentum.
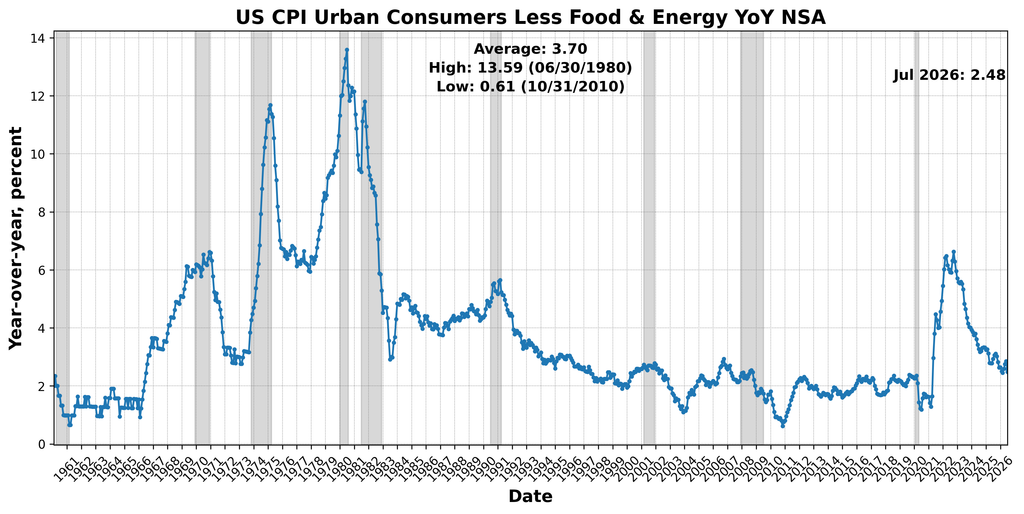
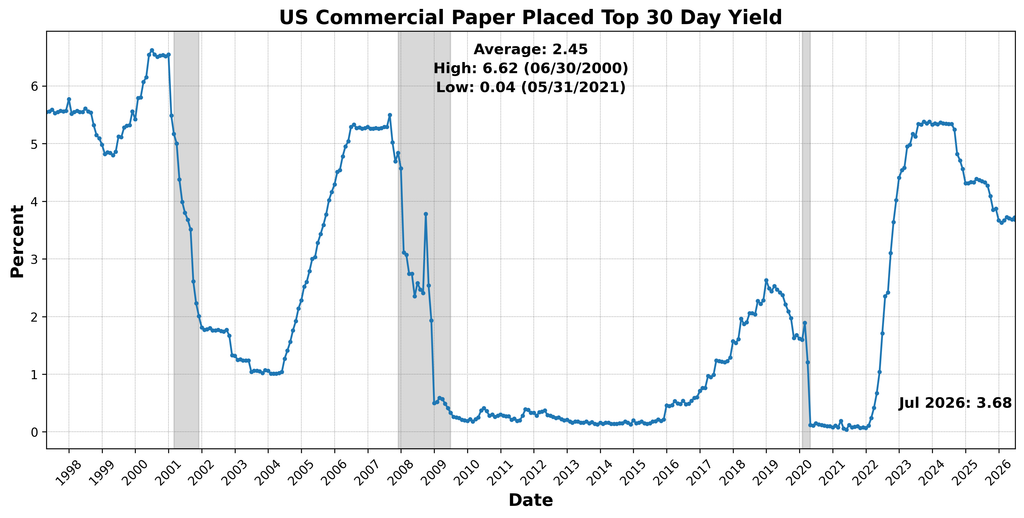
Two components restrained the index. US CPI Urban Consumers Less Food and Energy Year over Year NSA declined from 2.59 percent to 2.48 percent, a 4.2 percent decrease under the BCM’s month-to-month scoring calculation. US Commercial Paper Placed Top 30 Day Yield fell 1.1 percent, from 3.72 percent to 3.68 percent.
The increase in the Lagging Indicator from 58 to 67 indicates that trailing conditions became somewhat more broadly favorable in July. A decline in average unemployment duration, renewed growth in commercial and industrial lending, higher inventories, and stronger nonresidential construction spending outweighed the negative contributions from the core inflation measure and commercial paper yields. The result is a firmer lagging picture than in June, although the improvement reflects developments that characterize past or established activity rather than providing evidence of stronger growth ahead.
July’s BCM results therefore present a sharply divided configuration. Forward-looking conditions weakened considerably, with the Leading Indicator falling from 88 to 42 as housing, retail activity, transportation, business investment, margin borrowing, and the yield-spread signal deteriorated. Current conditions improved: the Roughly Coincident Indicator rose from 58 to 67 as gains in sales, income, production, and payroll employment outweighed weaker present-situation confidence and labor-force participation. Lagging conditions also strengthened, with the index increasing from 58 to 67.
Taken together, the July readings describe an economy in which current and trailing activity remained relatively firm even as the forward-looking signal lost substantial momentum. That divergence warrants caution. The improvement in coincident and lagging measures suggests that the economy continued to expand during July, but the decline in the Leading Indicator raises questions about whether that strength will persist. Confirmation from subsequent months will be necessary to determine whether July’s leading weakness represents a temporary reversal following June’s unusually strong reading or the beginning of a more durable slowdown.
DISCUSSION (August/September 2026)
August 2026 inflation data were notably firmer than July’s, with renewed energy and commodity pressures appearing at both the consumer and producer levels. Headline CPI rose 0.40 percent, up sharply from 0.07 percent in July, as gasoline prices jumped 3.9 percent, while core CPI accelerated to 0.29 percent from 0.22 percent. Despite the monthly pickup, year-over-year core inflation eased to 2.4 percent, its lowest rate since March 2021, and inflation breadth improved modestly: an estimated 52 percent of PCE components were rising faster than 3 percent from a year earlier, down from 54 percent in July. Goods inflation remained relatively contained, with core goods prices up just 0.1 percent and declines in computer software, medical commodities, and vehicle insurance providing evidence of continuing disinflation, but services strengthened as lodging jumped 2.4 percent and airfares rose 2.7 percent. Producer prices reinforced the less benign near-term picture. Headline PPI increased 0.4 percent and 5.4 percent from a year earlier, while core PPI rose 0.2 percent and 4.6 percent, respectively, as higher oil and commodity prices pushed transportation and warehousing costs up 2.3 percent and trucking costs 1.9 percent. More importantly, several components feeding into the PCE deflator were unexpectedly strong, including hospital services and airfares, pointing to a firmer August core PCE reading even after methodological revisions that should reduce measured inflation somewhat. Taken together, the August data show that underlying disinflation has not disappeared, but the renewed pressure from energy, freight, goods inputs, and selected services suggests that the path back toward price stability remains uneven and increasingly exposed to commodity and supply-chain shocks.
Meanwhile, the US labor market is settling into an unusual equilibrium: companies are doing relatively little firing, workers are increasingly reluctant to leave voluntarily, and hiring remains concentrated in a handful of industries. July job openings recovered only slightly to 7.27 million after June’s sharp decline, leaving 1.05 vacancies for every unemployed worker, while the quits rate slipped to 1.9 percent and layoffs fell to 1.0 percent. ADP’s August report told a similar story, with private employers adding only 38,000 jobs, the weakest increase since January. Pay growth was unchanged at 4.4 percent for workers remaining in their jobs and slowed to 7.3 percent for those switching employers, another indication that the wage premium associated with labor-market mobility is narrowing.
Against that subdued backdrop, the government’s August nonfarm payroll number was strikingly strong. Nonfarm employment increased 162,000 after a revised 21,000 gain in July, pushing the three-month average to 71,000, still only about half its spring pace. The headline strength also deserves qualification. Leisure and hospitality added 62,000 positions, including 59,000 at restaurants and bars, following unusually large World Cup-related employment swings earlier in the summer; an exceptionally mild August seasonal adjustment amplified the rebound. Construction added 22,000 jobs and manufacturing 16,000, consistent with strong defense and data-center investment, while information lost 23,000 positions and financial activities shed 11,000. The household survey recorded a 569,000 increase in employment, but roughly 350,000 came from workers aged 55 and older, while prime-age employment was essentially unchanged. A 683,000 expansion in the labor force raised participation to 61.6 percent and kept unemployment at 4.1 percent. The broader picture is therefore less a return to vigorous hiring than a stabilization after the early-summer deterioration: layoffs remain scarce and some capital-intensive sectors are competing for workers, but openings, quits, ADP payrolls, and the underlying pace of job creation all describe a labor market with substantially less churn and bargaining power than prevailed earlier in the expansion.
Factory output is holding up better than the demand indicators behind it, while service businesses are managing the opposite feat: stronger demand and activity with almost no corresponding appetite for additional workers. The manufacturing PMI slipped from 55.6 to 54.6 in August, its eighth straight month in expansion territory, but the internals were less encouraging. New orders fell three points to 53.7 and backlogs dropped to 51.8, while production gave back just 0.2 point of July’s 6.3-point jump. That gap cannot persist indefinitely. For now, customer inventories remain lean enough to keep factories busy, although obtaining the inputs needed to do so is becoming more difficult. Supplier delivery times lengthened again, electronics and other components became scarcer, and prices paid held at 71.1 as higher petroleum, metals, and tariff-related costs worked their way through supply chains. Employment slipped to 51.2, and among the six largest manufacturing industries only transportation equipment reported an increase in hiring.
Services are telling a different, and perhaps more interesting, story. The PMI rose from 54.1 to 55.4, with business activity, new orders, and backlogs all strengthening. Employment barely budged, however, moving from 47.4 to 47.8 and remaining in contraction. Firms are finding ways to accommodate more business without adding many workers, and the details suggest AI investment is increasingly part of that process. GPUs joined the list of commodities in short supply, memory remained scarce and expensive, and respondents reported substantial investment in computing capacity, power generation, and transmission. None of that comes cheaply. Services prices paid climbed from 70.3 to 72.6, with 15 industries reporting higher costs and not one reporting a decline. The manufacturing pipeline is thinning while factories continue working through existing demand; services, meanwhile, are expanding with remarkably little hiring. What both have in common is increasingly expensive physical capacity, whether that means fuel, metals, electronics, computing hardware, or the electricity required to run it.
Rising prices are again showing up in measures of confidence although the underlying evidence on spending and employment is considerably less alarming. University of Michigan consumer sentiment fell from 51.7 to 47.8 in early September, more than 13 percent below its year-earlier level, with expectations dropping particularly sharply to 45.8. The most obvious culprit is inflation. Year-ahead expectations jumped from 4.0 to 4.6 percent as fuel prices rebounded, while longer-term expectations edged up to 3.4 percent. Yet consumers became slightly less worried about losing their jobs, and real spending was still growing at better than two percent year over year in July. The familiar gap between what households say and what they do therefore remains unusually wide. Small businesses have a more tangible reason for becoming cautious. The NFIB optimism index fell 1.1 points to 98.7 in August as actual sales weakened, profit trends deteriorated, and expectations for business conditions declined. Hiring plans eased to a net 17 percent of firms and planned capital spending slipped to 25 percent, although both remain reasonably firm by recent standards. Inflation also moved up the list of owners’ concerns, with higher metals, petroleum, and other input costs increasingly squeezing margins. There is little here to suggest that domestic demand has suddenly broken. What has changed is the environment surrounding it: households are again noticing higher prices, while businesses are confronting those same pressures from the other side of the transaction, through higher costs and weaker realized sales.
But having said that, whatever caution consumers are expressing in surveys has yet to reach the cash register. Retail sales rose 1.2 percent in August after falling 0.5 percent in July, with higher gasoline prices accounting for about a quarter-point of the increase and autos providing another modest boost. More tellingly, control-group sales, which strip out gasoline, autos, building materials, and restaurants, surged 1.4 percent against expectations of only 0.5 percent. Online spending rebounded 2.6 percent as the distortions surrounding Amazon’s earlier-than-usual Prime Day faded, while back-to-school purchases helped lift electronics and sporting goods sales. Spending at restaurants and bars rose another 1.2 percent. On present trends, real consumption appears capable of growing slightly above 3 percent in the third quarter, not far below the second quarter’s 3.4 percent pace. That is difficult to reconcile with survey measures suggesting a consumer in retreat.
The weakness is instead concentrated where financing costs matter most. Housing starts fell another 2.6 percent in August to a 1.275 million annual rate following July’s 9-percent decline. Single-family starts bounced 7.6 percent, but multifamily construction dropped nearly 22 percent, and permits fell in both categories. The latter is more consequential for the months ahead: permits declined 1.8 percent for single-family homes and 4.3 percent for multifamily projects as mortgage rates, labor shortages, material costs, and poor affordability continued to weigh on builders. The consumption picture is thus stronger than the confidence data imply, but hardly uniform. Households remain willing to spend on goods, restaurants, and discretionary purchases while recoiling from the largest and most credit-dependent purchase most of them will ever make. Housing is increasingly where the effects of higher rates are visible, rather than in consumption generally.
Business investment is running well ahead of the factories that should, at least in principle, be registering some of it. Industrial production went nowhere in August, and the headline would have been negative without a 1.8 percent increase in utilities output as warmer weather lifted electricity demand. Manufacturing fell 0.3 percent, its first decline this year, with durable-goods production down 0.5 percent and capacity utilization slipping to 75.7 percent. Construction supplies fell 0.7 percent, while defense and space equipment declined 1.2 percent. None of that sits especially comfortably beside the increasingly familiar account of AI, data centers, defense spending, and related capital investment driving US industrial activity.
But the investment data themselves remain difficult to argue with. Durable-goods orders were flat overall, yet core capital-goods orders, excluding defense and aircraft, jumped 1.6 percent after July was revised substantially higher. Primary metals, machinery, and electrical equipment led the advance. Compared with a year ago, orders are up 20.1 percent for primary metals, 16.5 percent for computers and electronics, and 15.1 percent for machinery. More important for current GDP, core capital-goods shipments rose 0.6 percent and are running at a 14.1 percent annualized pace so far in the third quarter. There is a genuine disconnect here, but not yet a contradiction. Companies are ordering and receiving equipment at rates consistent with a vigorous investment cycle even as domestic factory output stumbled in August. One month can be noise. If the divergence persists, though, it will become worth asking how much of the capital-spending boom is reaching US manufacturing, where it is showing up, and whether an investment cycle increasingly identified with AI is as broad as the aggregate numbers make it appear.
September’s 25-basis-point Fed funds hike did more than raise the target to 3.75 to 4.00 percent. It revealed a Fed that has become considerably less tolerant of inflation remaining above 2 percent. Sixteen FOMC participants now expect at least one more increase this year, four expect another 50 basis points, and the median path shows no reversal in 2027. That is a fairly aggressive policy path for projections that otherwise changed very little. Growth was nudged up to 2.3 percent this year and 2.4 percent next year, unemployment was marked down to 4.1 percent through 2028, and the inflation forecasts moved only slightly higher, to 3.7 percent for headline PCE and 3.4 percent for core. Warsh described an economy operating near full employment, with insufficient progress on inflation and new geopolitical risks layered on top. The more important clue may be buried in the statement itself: policy is now intended to produce a “timelier return” to 2 percent. That is a different standard from accepting a slow glide downward while protecting employment. And it comes at a peculiar moment, with long Treasury yields already doing some of the Fed’s work by raising borrowing costs well beyond the overnight market.
The Beige Book makes clear why that choice is not straightforward. There is plenty of strength in the economy, but it is concentrated in some unusual places. Manufacturing improved across most districts, defense activity is strong, data-center construction continues at a remarkable pace, and higher-income households are still spending freely, including on travel. Skilled labor in those areas remains scarce and expensive. Energy, freight, metals, petrochemicals, healthcare, and insurance costs are also moving higher. Move away from those sectors, though, and the picture changes. Retail and hospitality hiring is softer, automobile demand remains weak, and businesses selling directly to consumers are finding it harder to pass higher costs along. Margins get squeezed in the process. AI further muddies the labor picture because it is creating jobs and eliminating the need for them at the same time, depending on the firm and industry. Ten of the 12 Fed districts are still growing, so this is not an economy grinding to a halt. It is one in which the hottest areas increasingly revolve around capital spending, defense, technology infrastructure, and affluent consumers, while other businesses encounter customers who are becoming much more careful about price.
That same split runs through nearly every August indicator. Consumers spent heavily despite telling surveyors they felt miserable: control-group retail sales jumped 1.4 percent and third-quarter consumption is tracking around 3 percent, while housing continues to buckle under mortgage rates and poor affordability. The labor market produced a surprisingly large payroll gain and unemployment remained at 4.1 percent, but workers are quitting less, openings remain subdued, ADP hiring is weak, and prime-age employment went essentially nowhere. Factories are still busy even as new orders and backlogs soften. Businesses, meanwhile, continue ordering and taking delivery of capital equipment at rates consistent with a substantial investment boom, although manufacturing output fell in August. Inflation has not so much returned as migrated. Some earlier pressures have faded while gasoline, transportation, metals, electricity, and selected services have taken their place.
The US economy is still expanding, and in several places expanding rapidly, but the sources of that growth are becoming narrower and more capital-intensive. That matters for economic policies broadly, but considerably more for monetary policy. Indeed: higher rates are a blunt instrument against an energy shock, a shortage of skilled tradesmen, and a rush to build data centers. They are considerably more effective against housing, credit-dependent businesses, and households that were already feeling the squeeze.
LEADING INDICATORS
ROUGHLY COINCIDENT INDICATORS
LAGGING INDICATORS
CAPITAL MARKETS PERFORMANCE
To maintain consistency in the preparation and presentation of the AIER Business Conditions Monthly, portions of the report are completed with the assistance of artificial intelligence. All analysis, conclusions, and final editorial decisions are reviewed by AIER research staff.

 点赞
点赞 收藏
收藏 点踩
点踩 分享
分享