Five frontier LLMs fact-checked the same 1,000 claims. They disagree on 63% of them.

Frontier LLMs often achieve similar results on public benchmarks, which can lead to the belief that they can be used interchangeably to verify facts. We took the 1,000 most recent claims submitted by users to a fact-checking platform and measured the disagreement between five frontier models. We asked each model to assign a verdict to every claim on a five-point scale from True to False and to report its confidence in that verdict. Among the 997 claims for which all five models returned a usable verdict, there was some disagreement on 63%. On 23% of the claims, the two most distant verdicts differed by at least two categories. High confidence from an individual model was not enough to show that the other models would agree with its verdict. Although the models reported confidence levels of 9 or 10 in 76% of their answers, they still disagreed on 63% of the claims.
Methodology
The claims were submitted to Lenz.io for fact-checking between May 1 and July 18, 2026. To identify near-duplicates, we embedded the claims using OpenAI’s text-embedding-3-small and measured the cosine distance between them, retaining one canonical claim from each group of near-duplicates. We then gave the same prompt to Claude Fable 5, GPT-5.6-Sol, Gemini 3.1 Pro + Search, Sonar Deep Research, and Grok 4.5. The prompt defined each of the five verdict categories and asked the models to provide their reasoning, select a verdict, and report a confidence level from 1 to 10. Web retrieval, as well as deep thinking, was enabled for all five models. For the analysis, we used only claims for which all models gave an answer. Since Claude Fable 5 refused to answer 145 of the claims, we used Opus 4.8 as a fallback, but on three claims, both models failed to answer. We didn’t conduct human labelling of the claims, so we analysed only the disagreement between the models and didn’t assert that any model was more accurate than the others.
Results by verdict
For each claim, we begin by analysing whether at least three of the five models give the same answer. If such a majority exists, we measure how many of the other models dissent. We found out that in 37% of the claims there is unanimity, while in 11% of the claims there is no majority at all.
Although in 63% of the claims the models disagree, not all disagreements are the same. We measure this by ranking each verdict as follows: True(0) -> Mostly True(1) -> Mixed(2) -> Mostly False(3) -> False(4). Then we look at the maximum verdict distance. These were the results:
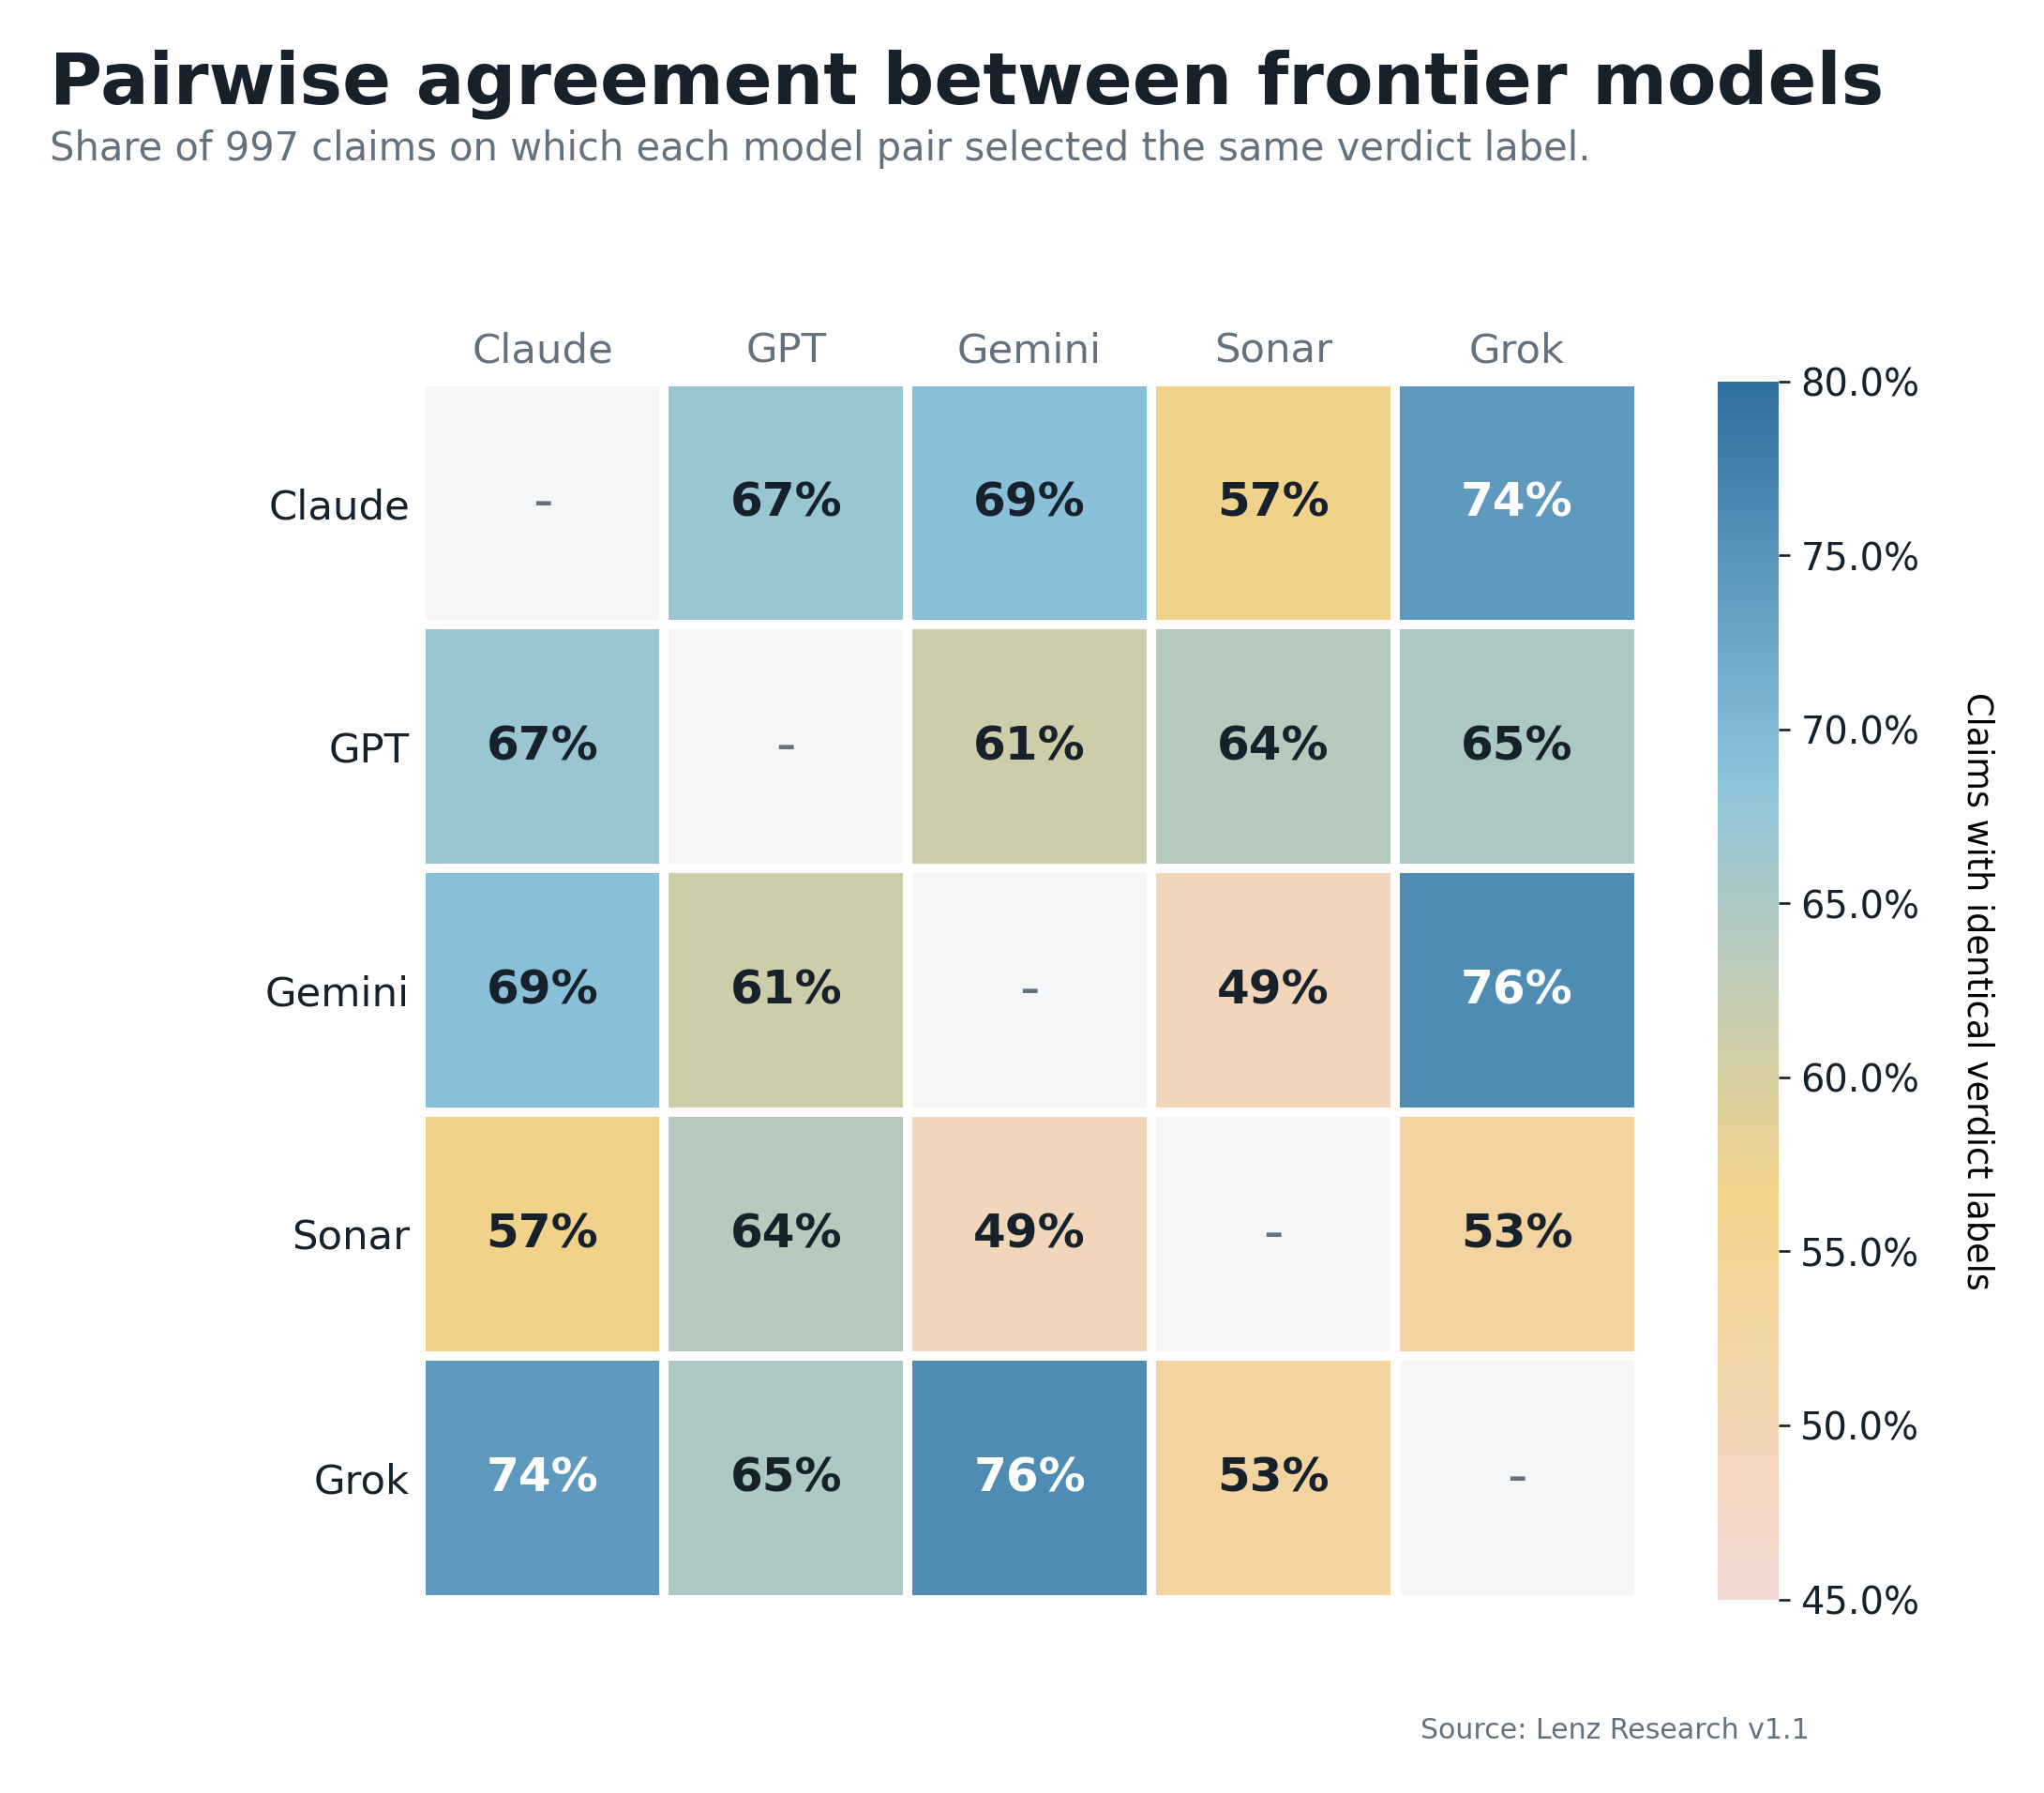
It is also interesting to look at the pairwise disagreement between the models. We found out that on the 997 claims Grok and Gemini agree on 76% of the claims, while Gemini and Sonar have the lowest agreement percentage, agreeing on 49% of them.
Most model answers fall into the two polar verdict categories, classifying the claims as True or False.
To compare each model with the rest of the panel, we look at how often it aligns with the strict majority—3 out of the other 4 models need to give the same verdict in order for there to be a strict majority. Fable 5, Grok 4.5, and Gemini 3.1 Pro agree much more with the panel than Sonar Deep Research, which is not that surprising when looking at the verdict distributions per model. Sonar Deep Research is the model with the most uniform distribution across the verdicts.
Lastly, we present three graphics that we found interesting:
Results by confidence
In addition to the verdict, every model was also asked to report a confidence level on a scale from 1 to 10. Again, for consistency, we are looking only at the 997 claims for which all five models returned a verdict.
Firstly, we looked at the distribution of confidence for each of the models. Already from the first figure, we can see that all of the models report very high confidence, with a mean value of 8.99 across all answers. This is surprising, taking into account the fact that the disagreement between the models was 63%. It looks like Fable 5 is the least confident model of the five, while Gemini reports a confidence level of 10 for 70% of its answers. It looks like this is related to the polarity of the answers. Gemini is the model that reports polar answers (True or False) on 83% of the claims.
Next, we will look at the relationship between confidence and disagreement for each claim. We take as the confidence floor the lowest confidence reported by any of the models. For each category, we analyse the disagreement between their verdicts. Here, we can see that even though all models report a confidence of at least 7 on more than 800 claims, the verdict disagreement is still 59%. At the same time, when all models reported a confidence of 10, they almost never disagreed. It would be interesting if we had human labels for each claim to see whether there are any claims for which all models are very confident and report the same verdict, but the verdict differs from the human-reported one. If there were no such claims, we could conclude that if several models report 10/10 confidence on any claim, then it is almost surely the correct verdict.
In the next figure, we divide the confidence levels into five buckets depending on the reported level: Very Low (1–2), Low (3–4), Mid (5–6), High (7–8), and Very High (9–10). We are aware that by dividing them in this way, we lose information from the study and treat confidence levels 5 and 8 as being only one bucket apart. This is a limitation, but for consistency with the verdict results, we want to analyse disagreement in confidence in a similar way. On the other hand, we wanted to give the models more freedom when reporting their confidence, which is why we originally asked them to use a scale from 1 to 10 instead of the same five-point scale used for the verdicts.
To measure the distribution of confidence ratings by domain, we examine all 4,985 responses from the five models across the 997 claims for which every model provided a verdict. The results are presented below:
As expected, when the models answer in the two polar buckets, their confidence is Very High almost every time. That’s why Gemini’s mean confidence is so high, since this is the model that gives the most polar answers of all the models.
Finally, we look at the relationship in the opposite direction. We group the individual model answers by their reported confidence bucket and analyse the distribution of verdicts within each group. The pattern is clear: when the models are very confident, they are more likely to give polar verdicts. In the Mid and High confidence buckets, intermediate verdicts are much more frequent. Unfortunately, the Very Low and Low confidence buckets contain only 24 and 19 answers, respectively, so we do not have enough data to draw conclusions from them.
Conclusion
This study measures the consistency among frontier LLMs on real-world claims. Across the 997 claims, the models diverge substantially on 23% of them and in some form on 63%. The panel’s ordinal Krippendorff’s α of 0.77 places its agreement below the threshold at which a set of raters can be treated as interchangeable. The disagreement is therefore neither negligible nor random. It is part of how these systems adjudicate claims and find information on the internet.
What both analyses show is more informative than either of them separately. We can say that polar verdicts more or less move together with high confidence. When the models report the highest confidence, it looks like they agree almost every time, while if one of them is even slightly concerned the disagreement is substantive.
We are aware of the absence of ground truth for any of the claims and that's why we can only analyse the disagreement between them. Still, we believe that these are very relevant results and should be taken into account when we rely on LLMs. A natural next step for the study is to establish human labelling and examine the correctness of each model’s verdict.
Reproducibility
The full paper can be found here: https://lenz.io/research
The full code with the claims and the responses from the models can be found here: https://github.com/lenzhq/lenz-research
The dataset with the claims is available here: https://huggingface.co/datasets/DavidYor06/llm-disagreement.

 点赞
点赞 收藏
收藏 点踩
点踩 分享
分享