Survey Statistics: Pew Research finds “No Easy Fix for Bogus Respondents in Online Opt-In Polls”

I just read the Pew Research Center’s new report “No Easy Fix for Bogus Respondents in Online Opt-In Polls”. It begins:
One of the most urgent problems in online opt-in polling is bogus (or fraudulent) respondents. These are survey-takers who make no effort to answer questions truthfully and instead are just looking to finish surveys quickly and collect rewards.

To address this, they try 3 screening methods: 1) trap questions, 2) prescreening, and 3) voterfile matching. There is no direct way to know how many bogus respondents are removed with each method. So instead they compare them with 3 data quality measures: 1) “yea-saying”, 2) quality of open-end responses, and 3) response order effects.

The “yea-saying” data quality measure is the % who say “yes” to at least 10 of 15 questions. Without screening, this was 7%. At first this seemed fine to me and I was confused why this is even a data quality measure. But a probability sample estimates only 1% of people say “yes” to this many of these questions. Screening with trap questions helped the opt-in sample match the probability sample. One of their trap questions was asking if folks use a made-up social media platform called Fizzypress.
They made a separate set of calibration weights (see “3 flavors of survey weights”) for the unscreened sample and for the 3 screening method subsamples, calibrating to ACS along these dimensions:

How does screening for bogus respondents affect results for Harris-vs-Trump 2024 vote choice ?
Say we want E(Y), Harris vote choice in the population. But we only observe the opt-in sample, so we have nonresponse error (beyond Pew’s weighting adjustment): E(Y | R_opt_in = 1) – E(Y). Also, we only observe Y* != Y due to measurement error from bogus responses.
Say everyone we screen-in has no measurement error. Then the error with screening is nonresponse: E(Y | R_opt_in = 1, screened_in) – E(Y). This may be bigger than nonresponse error without screening: E(Y | R_opt_in = 1) – E(Y), but this isn’t knowable. We only know overall error including measurement error: E(Y* | R_opt_in = 1) – E(Y). Pew found that overall error was less without screening, screened-in folks overrepresented Harris.
How do opt-in samples compare to probability samples ?
Pew writes that there is “no way for potential bad actors to self-select into probability-based samples.” Of course, a randomly selected person can still give bogus responses (responding with Y* instead of their true Y). But the rate of measurement error in probability samples would match the population: P[Y != Y* | R_probability_sample = 1] = P[Y != Y*]. Whereas the rate of measurement error in opt-in samples is presumably higher due to folks selecting into the survey to earn rewards: P[Y != Y* | R_opt_in = 1] > P[Y != Y*]. In other words, the rate of measurement error is subject to nonresponse error, a mixing of the two sides of the Groves et al. figure below.
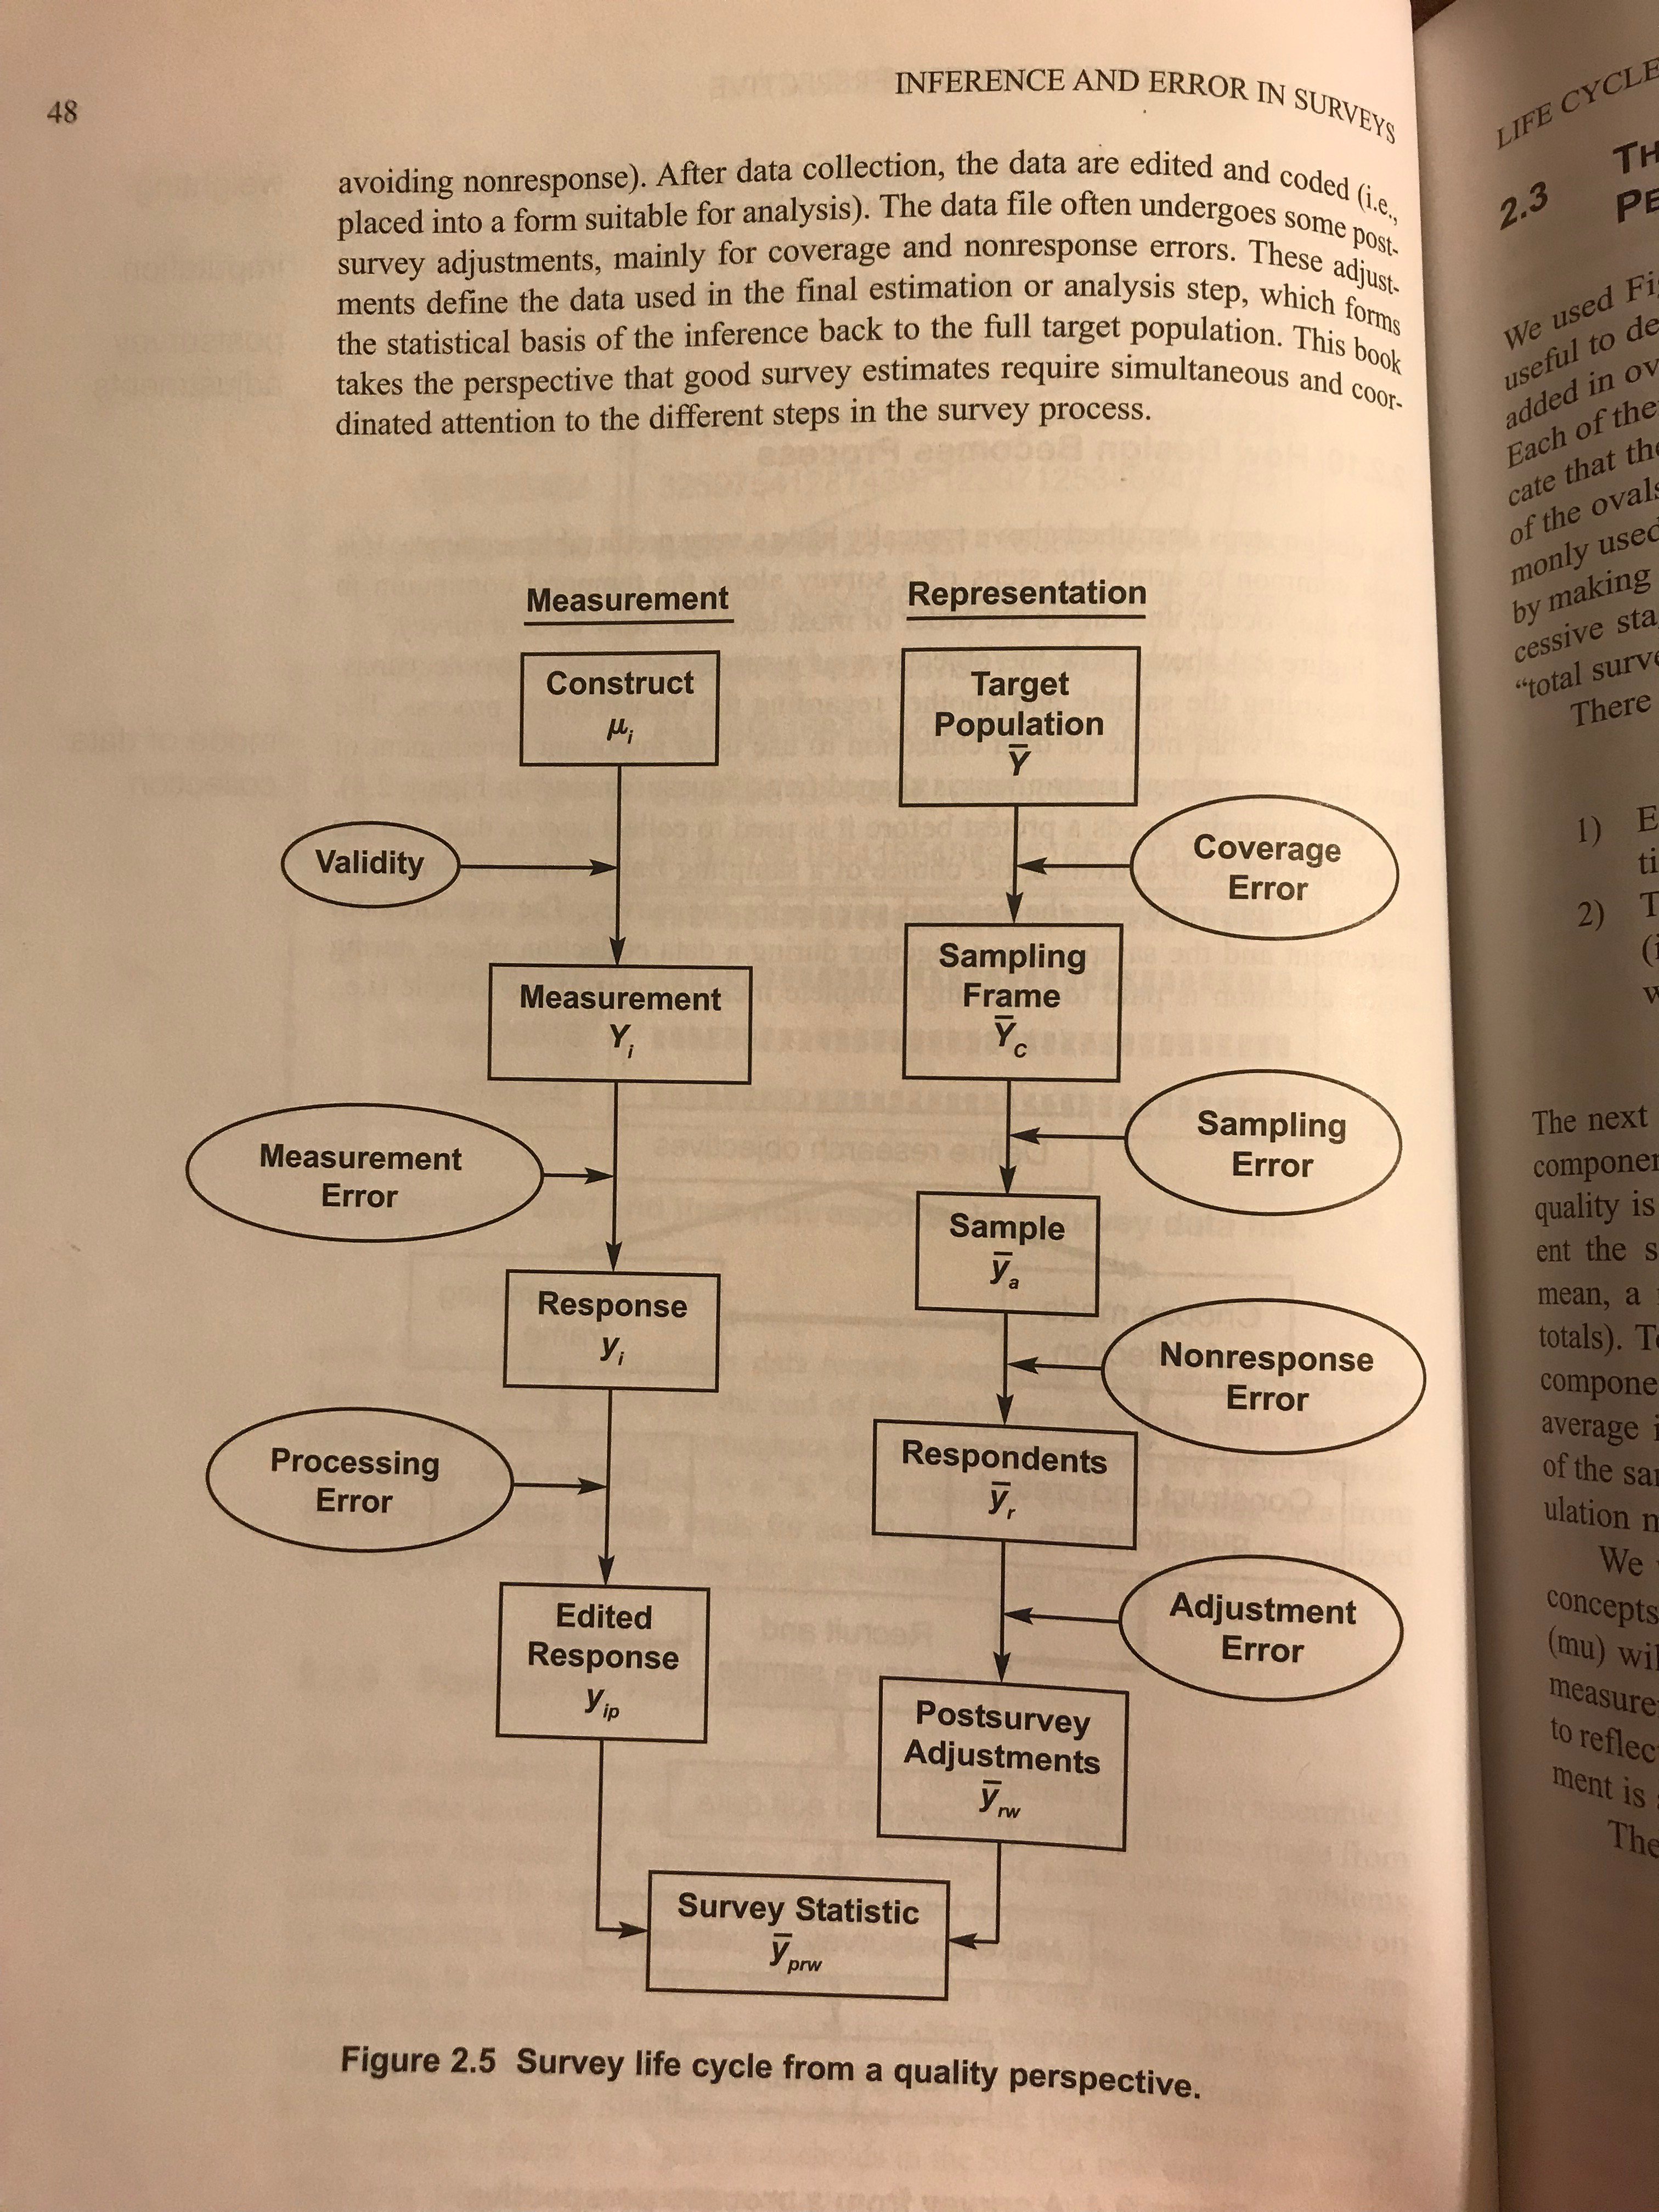
In this Survey Statistics series we’ve seen measurement error in an adjustment variable X, e.g. recalled vote: see “is a mismeasured X better than none at all ?”, “more adventures in mismeasured X”, “more on recalled vote”, “it is (still) the people”. We saw that the NYT used to drop adjustment for recalled vote due to its measurement error, which could worsen nonresponse error. Pew is studying the effect of screening out people with a lot of measurement error, which could worsen nonresponse error.
In this series we’ve also seen measurement error in the outcome variable Y, e.g. disease status, see “wanting workflow”. This example modeled the measurement error, rather than screen out mismeasurements.
Also relevant is Andrew’s post “She wants to know what are best practices on flagging bad responses and cleaning survey data and detecting bad responses. Any suggestions from the tidyverse or crunch.io?”.

 点赞
点赞 收藏
收藏 点踩
点踩 分享
分享