Stop Guessing at Hard Faults

CLion’s new AI skill lets agents find the root cause without manual digging.
Embedded debugging takes a lot of manual work. You’re flashing real hardware, juggling debug probes or DAP adapters, and when something goes wrong at a lower level (a hard fault), the processor doesn’t tell you why, only that it happened. Finding the actual cause means manually decoding CFSR and HFSR, cross-referencing the faulting program counter with disassembly, and often reproducing the crash several times to narrow it down.
CLion 2026.2.2 now handles exactly this for you with a new AI skill for hard fault debugging, backed by dedicated MCP tooling. The agent reads the fault registers, inspects memory and disassembly, and traces the problem back to its source – using the same debugger tools you would, just without you having to drive each step by hand. The solution is vendor-agnostic and is compatible with any debugging tool, including Lauterbach TRACE32, Segger J-Link, and ST-LINK. It’s also available for any agent run in CLion with access to the IDE’s MCP server.
Why does a hard fault tell you nothing?
A hard fault is an ARM Cortex-M CPU exception that occurs when something goes seriously wrong at a low level – for example, accessing invalid memory or overflowing the stack. The processor cannot safely continue running the code that triggered the fault. Developers can implement a handler that’s automatically called when a hard fault occurs. It typically captures forensic data before the state is lost, such as stacked registers and fault status registers. By default, though, most handlers halt execution without decoding the data, so they tell you only that a fault occurred, not the reason. That’s why debugging a hard fault can be difficult without additional tooling.
The hard fault skill is called clion-embedded-hardfault and is enabled by default in Settings | Tools | AI Assistant | Skills | Bundled skills. To use the skill, ensure you have enabled the MCP server in Settings | Tools | MCP Server.
Why not just let an agent run shell commands and read the code?
An agent with shell and file access can already attempt this, running a debugger command, reading the output, and guessing what to do next. Without dedicated tooling, that’s roughly what a hard fault investigation looks like – slow, and dependent on the agent correctly parsing register dumps from raw text.
The clion-embedded-hardfault skill activates on a narrower, well-defined trigger: a session stopped in HardFault_Handler (or its siblings MemManage_Handler, BusFault_Handler, UsageFault_Handler), or a mention of CFSR, HFSR, MMFAR, BFAR, or an exception stack frame. Instead of handing the agent a raw register dump to parse from text, it hands over evidence that’s already decoded. The fault status registers are interpreted rather than dumped. The hardware-stacked exception frame is captured before it can be overwritten. And the SVD-decoded peripheral registers behind the faulting memory-mapped access arrive alongside the disassembly and memory around the faulting instruction.
That data comes from CLion’s own understanding of memory maps, registers, and instruction encoding – not reconstructed by parsing terminal output. The agent starts from the actual faulting address and its meaning, instead of working backward from a crash log or staring at an infinite loop in a Cortex-M startup file.
How to debug a hard fault with an agent
When a debug session stops in a hard fault handler, run your preferred agent in CLion’s AI chat or terminal. Describe the problem in natural language, for example: “sometimes this hard faults, prob invalid mem access, find issue, make no mistakes”. You can also name the skill explicitly to make the task clearer.
The agent will follow the skill instructions to use the appropriate IDE tools via MCP.
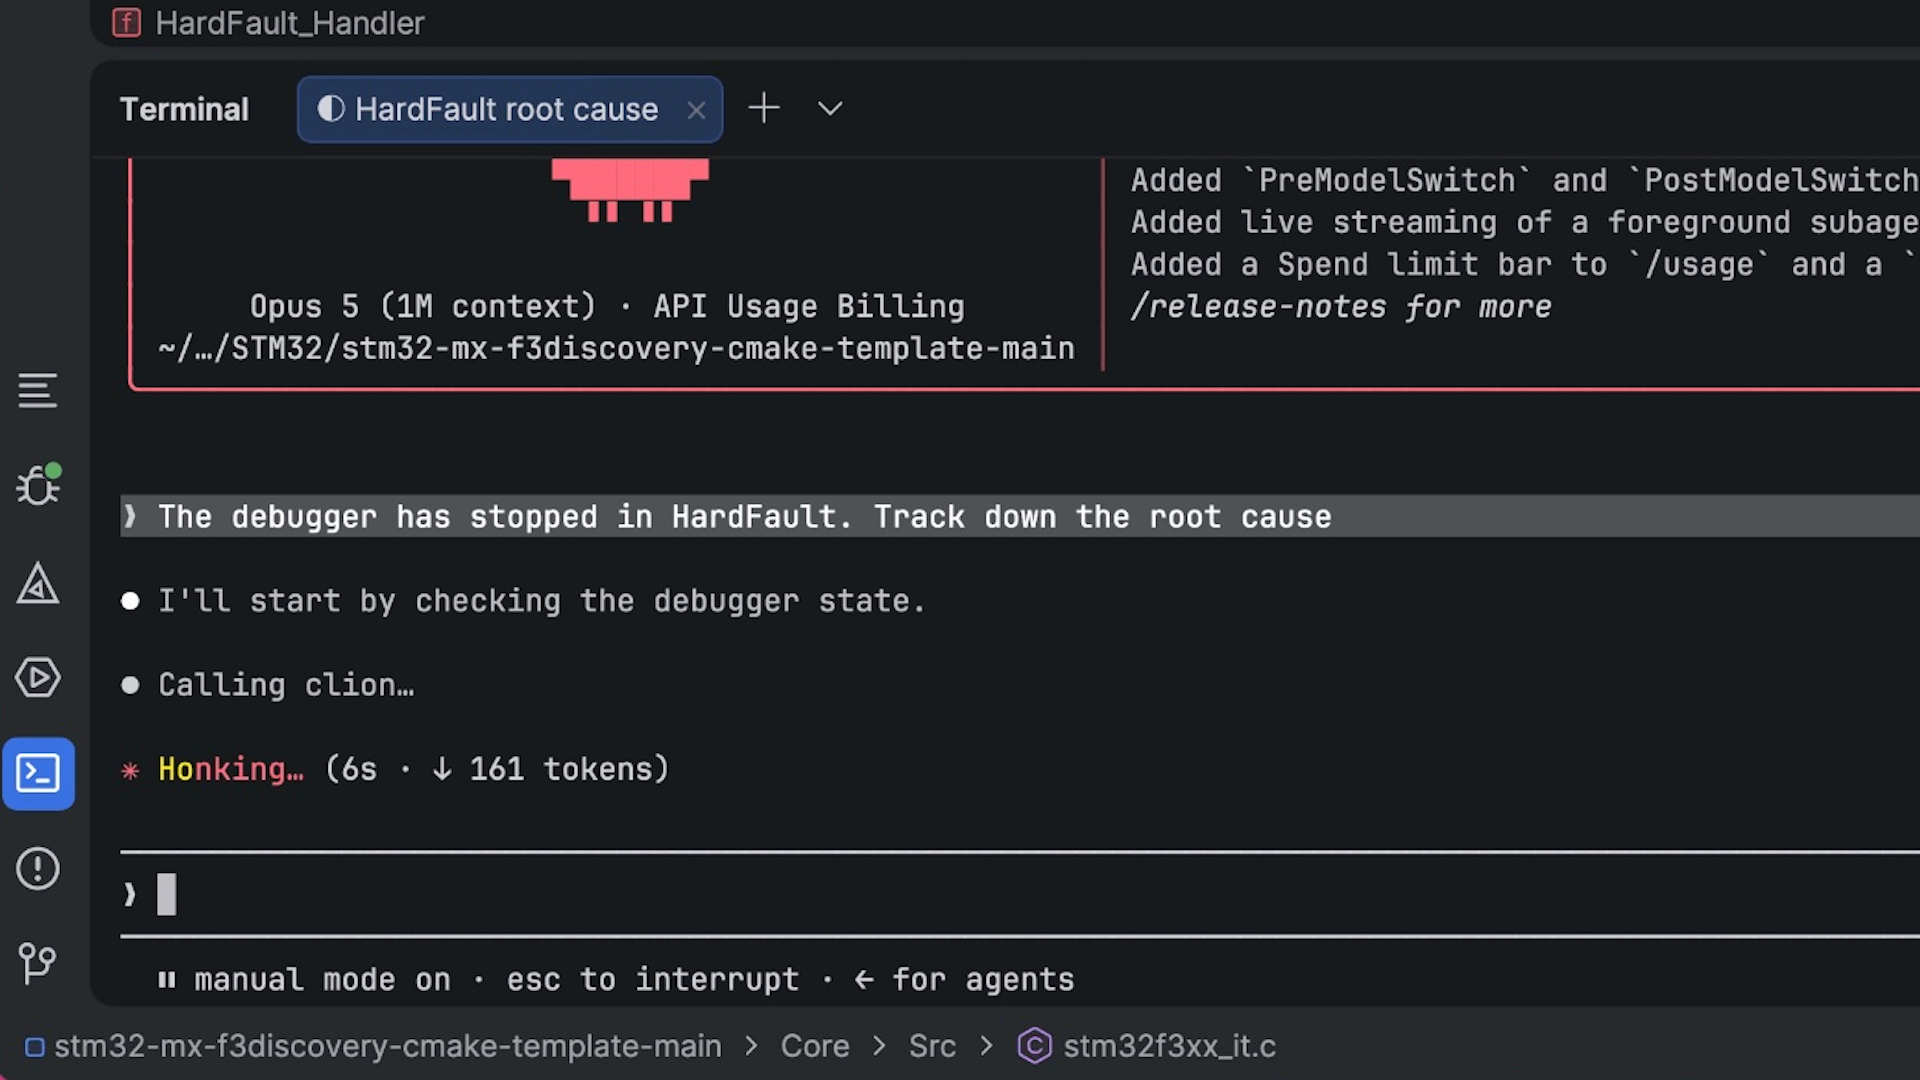
When the agent identifies the cause of the hard fault, it provides a detailed description, including where the bug is located and how to fix it.
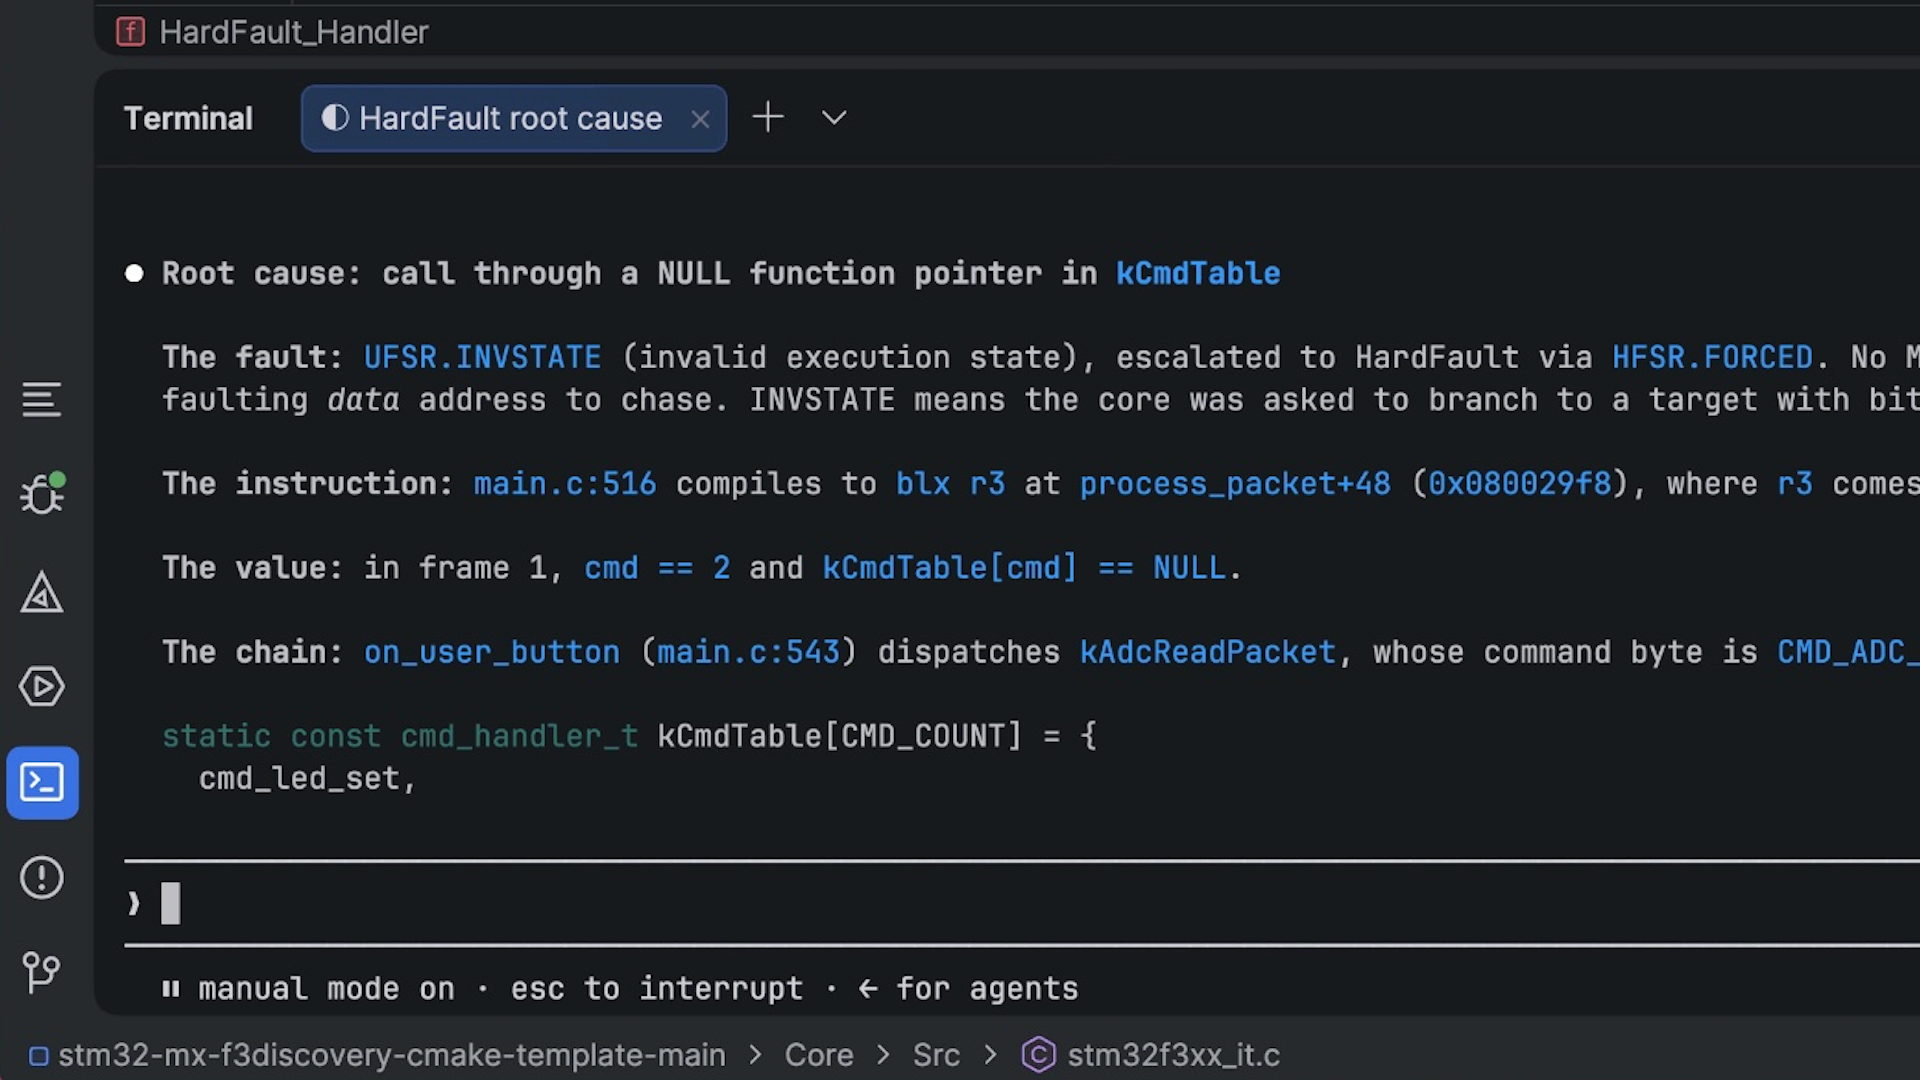
You can fix the bug manually or ask the agent to do this for you, including re-running the debug session to verify that the program works as expected.
Limitations
The hard fault debugging skill works in both AI chat and CLI mode for Claude Code and Codex, but only in CLI mode for GitHub Copilot.
Other debugger tools available for agents
The hard fault debugging skill is the next step in our improvements to agentic debugging. The underlying MCP tooling, though, is helpful for debugging embedded projects in general, giving agents access to memory, register values, and disassembly. These are useful for debugging non-embedded C and C++ projects, too.
In addition to the above, agents can perform basic debugger actions:
- Start, pause, and stop a debug session.
- Set and remove breakpoints.
- Step through code.
- Read local variables, frame values, and nested fields.
You can find all the MCP tools available for your agents in Settings | MCP Server | Exposed Tools.
Try the skill in CLion 2026.2.2
The AI skill for hard fault debugging is available in CLion 2026.2.2. It will also be added to the first upcoming 2026.3 EAP release. Try the skill with your own Cortex-M MCU and let us know what would make the workflow better for you!

 点赞
点赞 收藏
收藏 点踩
点踩 分享
分享