From Leaderboards to Model Profiles: A Deep Dive Evaluation of LLMs for Agentic Coding

Felix Plantenberg
Felix Plantenberg is a ML Engineer intern at JetBrains, working on improving Junie evaluation pipelines Beyond that, his work extends to satellite imagery processing, data analytics and process automation. builds and evaluates data-driven software. His background spans computer science, management and machine learning. LinkedIn
Marco Damonte
Marco Damonte is a ML Scientist at Jetbrains. He loves finding answers to difficult questions and mentoring junior scientists. LinkedIn
Beyond the resolve rate
Imagine plugging two LLMs from different frontier labs into the same coding agent and finding that they solve exactly the same number of benchmark tasks. If the evaluation stopped there, you might conclude that the models are interchangeable and simply choose the cheaper one.
This is what also happened on one of our private benchmarks: Claude Opus 4.7 and Gemini 3.5 Flash solved the same number of tasks. But the tie concealed two very different execution profiles. Opus used an average of 184 steps and cost $2.79 per run, while Gemini took an average of 271 steps but cost only $1.24. The final result was identical, but the way each model reached it was not.
This difference is invisible in the metric most often used to compare coding agents, which is the resolve rate. It measures how many tasks the evaluation tests pass, expressed in percent. While resolve rate answers an important question, namely whether the agent solved the task, it says little about how the solution was reached.
A coding agent such as Junie is more than the LLM behind it. Given an issue and a repository, Junie lets the model inspect files, search for symbols, edit code, run commands, and execute tests. These observable actions form the agent’s trajectory. A trajectory does not reveal the model’s private reasoning, but it does show how the model worked with the repository. We can see whether it localized the problem before editing, repeated the same searches, tested its assumptions, and kept the final patch focused.
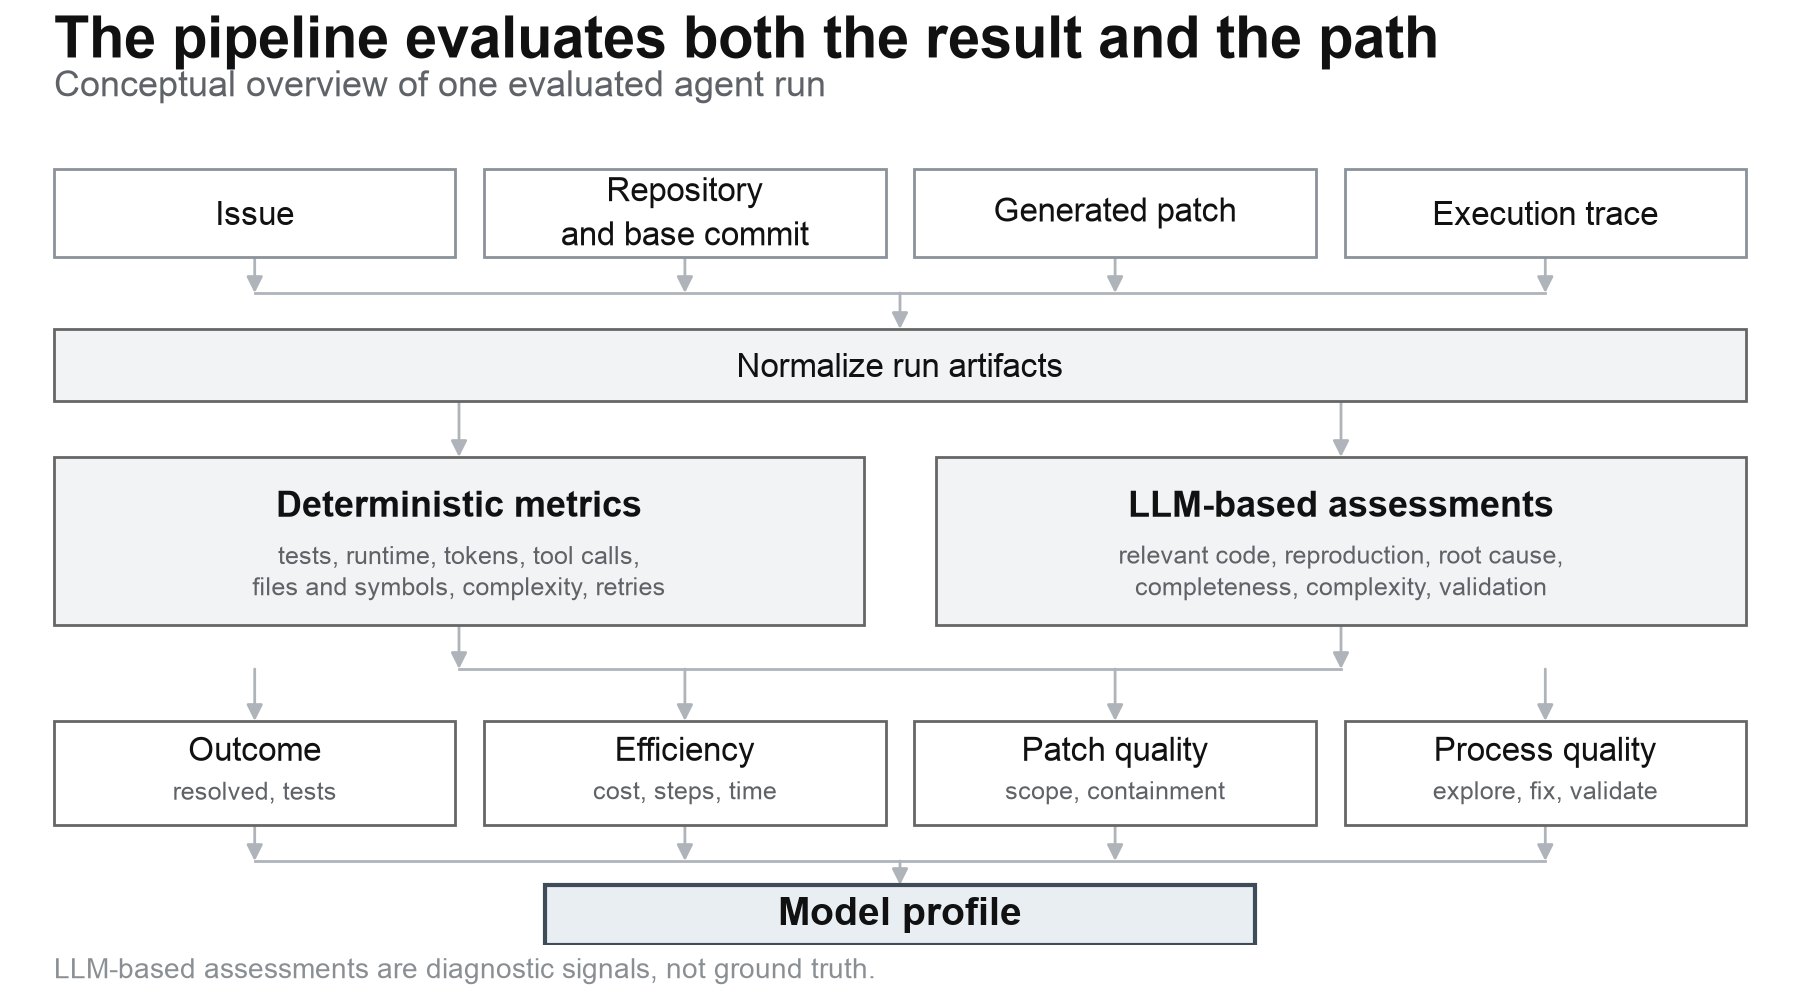
We built an evaluation pipeline that analyzes both the result and the path that produced it. It combines four perspectives: functional outcome, execution efficiency, patch quality, and process quality. Functional correctness remains the starting point, while additional metrics explain what lies behind the final score.
What current evaluations miss
A recent JetBrains Research post describes the benchmark meaning gap, identified in a recent research paper: a benchmark measures performance under a particular setup, but its score is often treated as evidence of a much broader coding ability. Performance gains may not transfer to other tasks, even within the same codebase, and model rankings can change with the task type.
Our work looks at a related gap within individual agent runs. Passing tests does not fully describe the patch quality. Two patches may implement the required behavior while differing greatly in scope, complexity, and fit compared to the existing architecture. For example, one may change a single relevant function. Another may add helpers, state, branches, or unrelated files – and still pass the same tests.
A failed outcome is equally ambiguous. The agent may never find the relevant code, may instead misunderstand the cause, edit the wrong layer, implement only part of the fix, or stop without adequate validation. These failures all require different actions. For example, a repeated search may call for better repository navigation or more focused prompting. Another example is a correct diagnosis of the issue followed by an incomplete patch. This suggests a problem in implementation or task completion.
Cost and latency add another dimension. As mentioned above, two successful runs can differ substantially in tokens, runtime, model calls, and tool use. A long trajectory is not necessarily bad if the task requires broad investigation. The important distinction is whether the extra work contributed to the solution, or it came from repeated and unproductive actions.
For model selection, the more useful questions are which model suits a particular kind of task, where it spends its effort, and how it tends to fail. This can be answered by a fine-grained analysis of both the trajectory and the patch through our pipeline.
Evaluating the outcome and the process
For each benchmark task, the pipeline combines the issue, repository context, generated patch, test result, and execution trace. It then evaluates the run from four perspectives, which ask the following questions:
- Outcome: Did the patch resolve the task, and which tests passed or failed?
- Efficiency: How many tokens, model calls, tool calls, and seconds did the run require, and what did it cost?
- Patch quality: Did the change touch the relevant files and symbols, remain contained, and avoid unnecessary complexity?
- Process quality: How did the agent move through exploration, implementation, and validation? Did it reproduce the problem, repeat work, or stop without testing the final change?
We propose a pipeline that combines deterministic metrics with semantic evaluation. The deterministic layer derives reproducible measurements from logs and repository data. These include test outcomes, runtime, token use, tool calls, modified files and symbols, code complexity changes, repeated file reads, unchanged command retries, and tool failure loops.
Rules alone cannot interpret every action. Opening a file twice may be wasteful, or it may be necessary after a related edit. A large patch may be unfocused, or it may be appropriate for a change that spans several components. For these questions, LLM judges receive structured evidence from the issue, patch, trajectory, and bounded repository context. They assess milestones such as finding the relevant code, reproducing the defect, identifying the root cause, addressing it in the patch, introducing unnecessary complexity, and validating the result. This combination gives us a clearer account of progress. It shows not only whether a run failed, but whether it failed during localization, implementation, or validation. Below figure serves as an illustration of the aforementioned components, inherent in our evaluation pipeline.
What the agent trajectories reveal
We used the pipeline to compare Claude Opus 4.7 and Gemini 3.5 Flash in Junie across four benchmark datasets containing 523 tasks. The results are shown below:
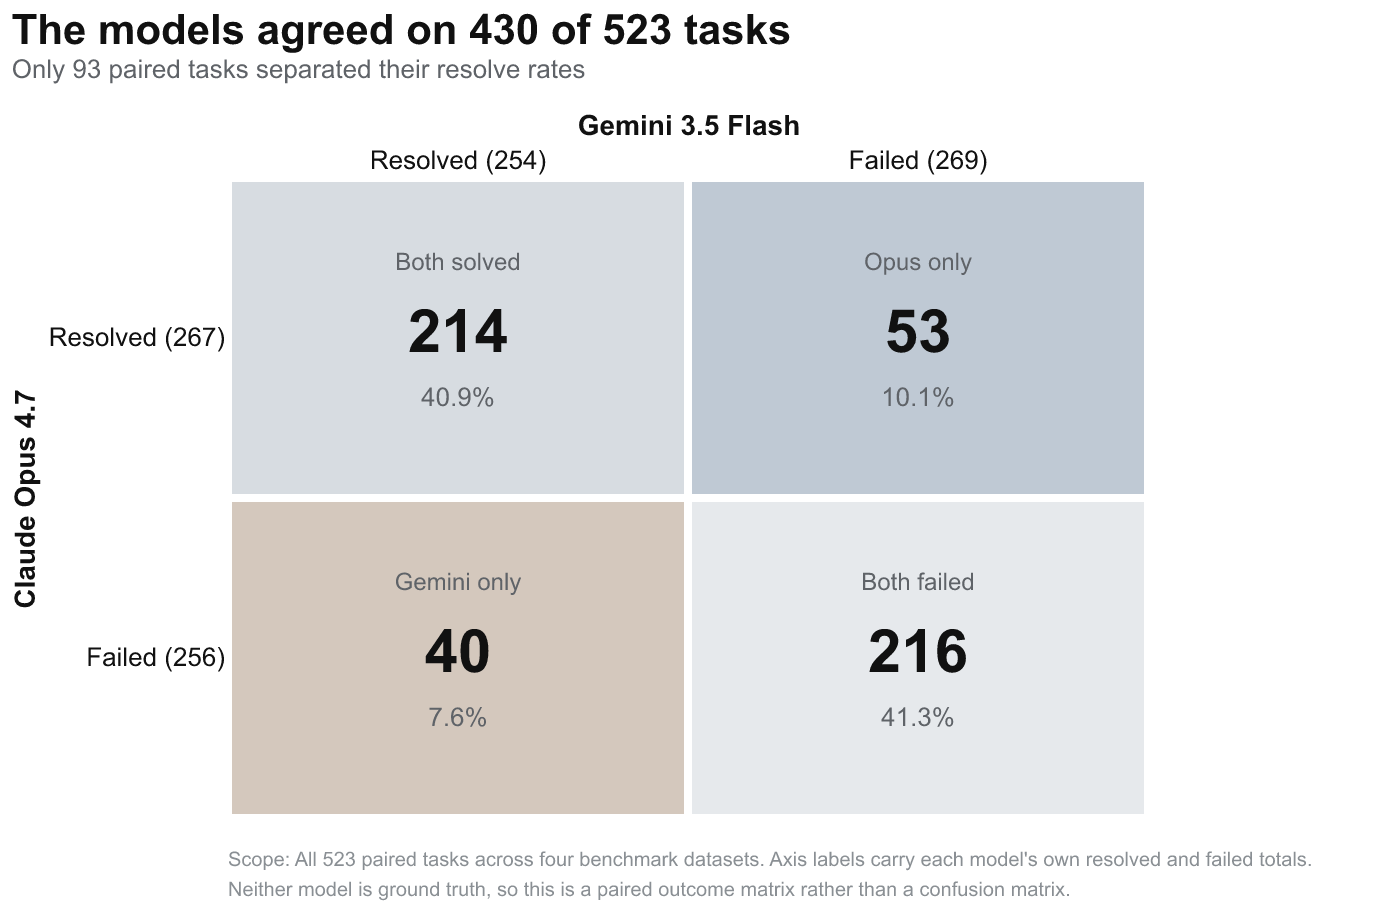
As you can see in the figure above, Claude Opus resolved 267 tasks, or 51.1 percent, while Gemini Flash resolved 254, or 48.6 percent. The models produced the same outcome on 430 tasks: both solved 214 and both failed 216. Only 93 tasks separated them. The overall scores were close, but the trajectories and patches showed different behavioral profiles.
Identical outcomes via divergent trajectories
A same-task comparison makes the different behavioral profiles concrete. One Opus run and one Gemini run both solved the same task. Both first opened a relevant file at step 15, were judged to have identified the root cause, and performed thorough validation. However, they had progressed in varying increments d by that point. Opus used a targeted search within the file and began implementation 13 steps later. Gemini initially inspected the large module more broadly. It ran its first executable check at step 30, but did not make its first production edit until step 88. Opus finished in 53 steps, moving between exploration, implementation, and validation six times; Gemini needed 192 steps and thirty-four such switches. The following figure depicts the different paths.
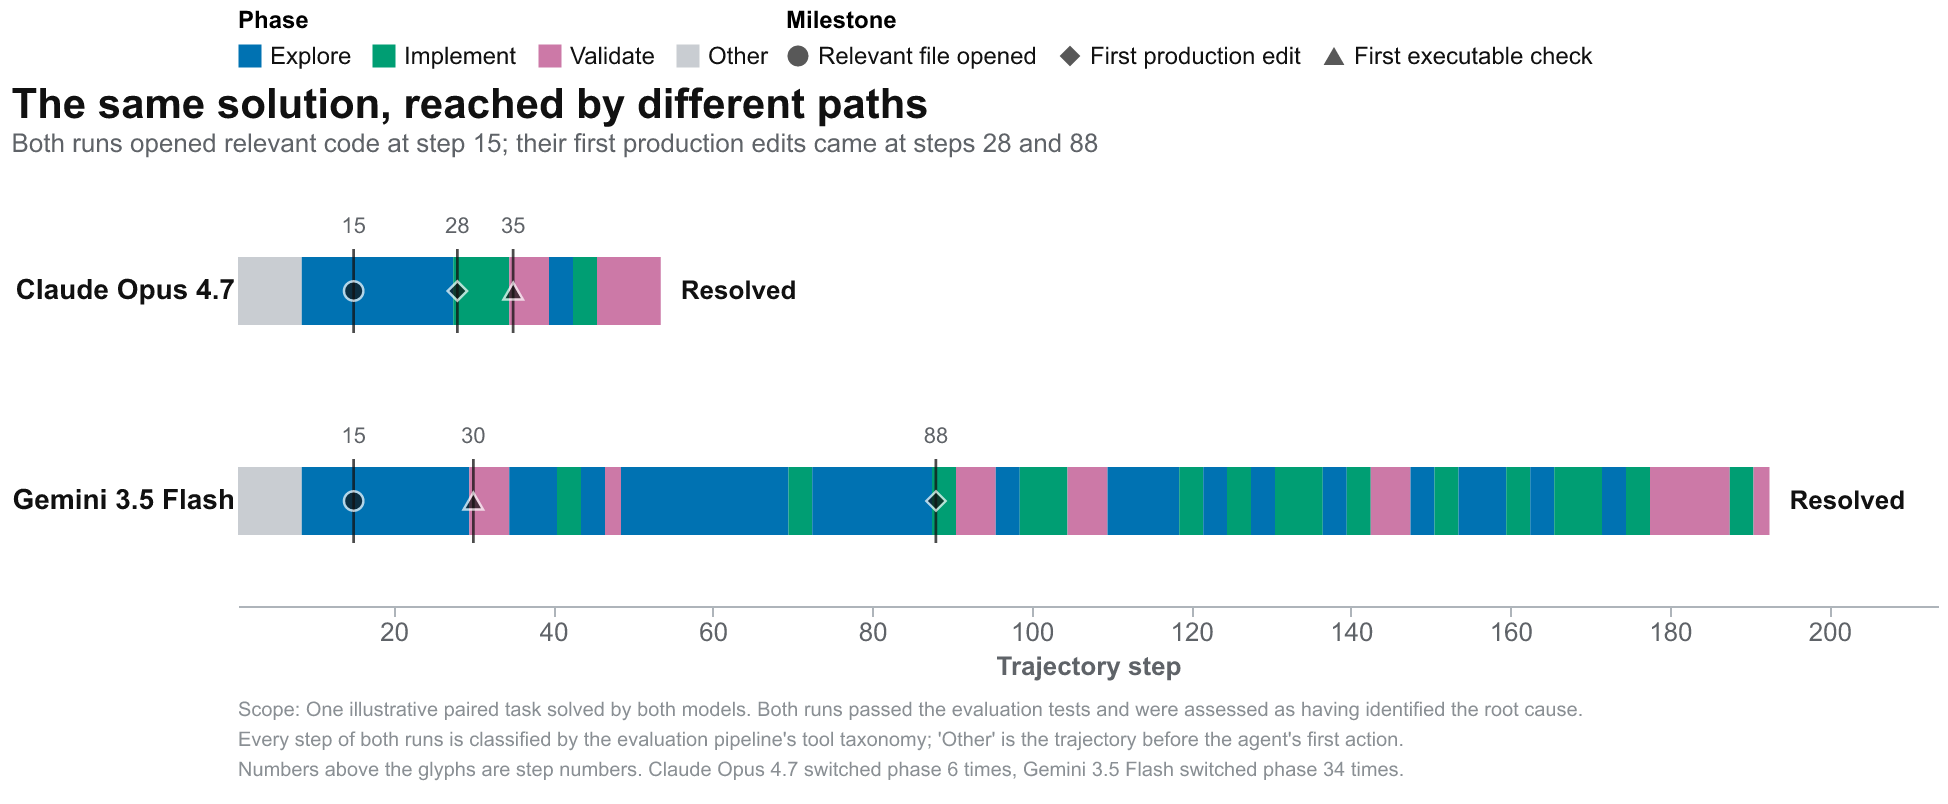
Gemini’s additional investigation was partly useful, but it also widened the scope and led to an unrequested change. Both runs passed the evaluation tests, and both changed the same file and symbols that the reference solution changed. Opus touched nothing else. Gemini’s patch also reached four further files, making edits there. It was assessed as sprawling, with significant redundancy and moderate hallucination.
This single example is illustrative rather than statistical. It shows how the same benchmark success can come from a direct, contained run or a longer path with unnecessary expansion.
Failure can occur at several stages
A successful run usually progresses through four stages: locating the relevant code, identifying the root cause, implementing the complete fix, and validating the result. Resolve rate compresses this entire process into a single binary outcome, whereas trajectory analysis shows where the agent succeeded and where it fell short.
As trajectory analysis separates them, we can better analyze the 216 tasks that both models failed. We can see the results of the analysis in the figure below.
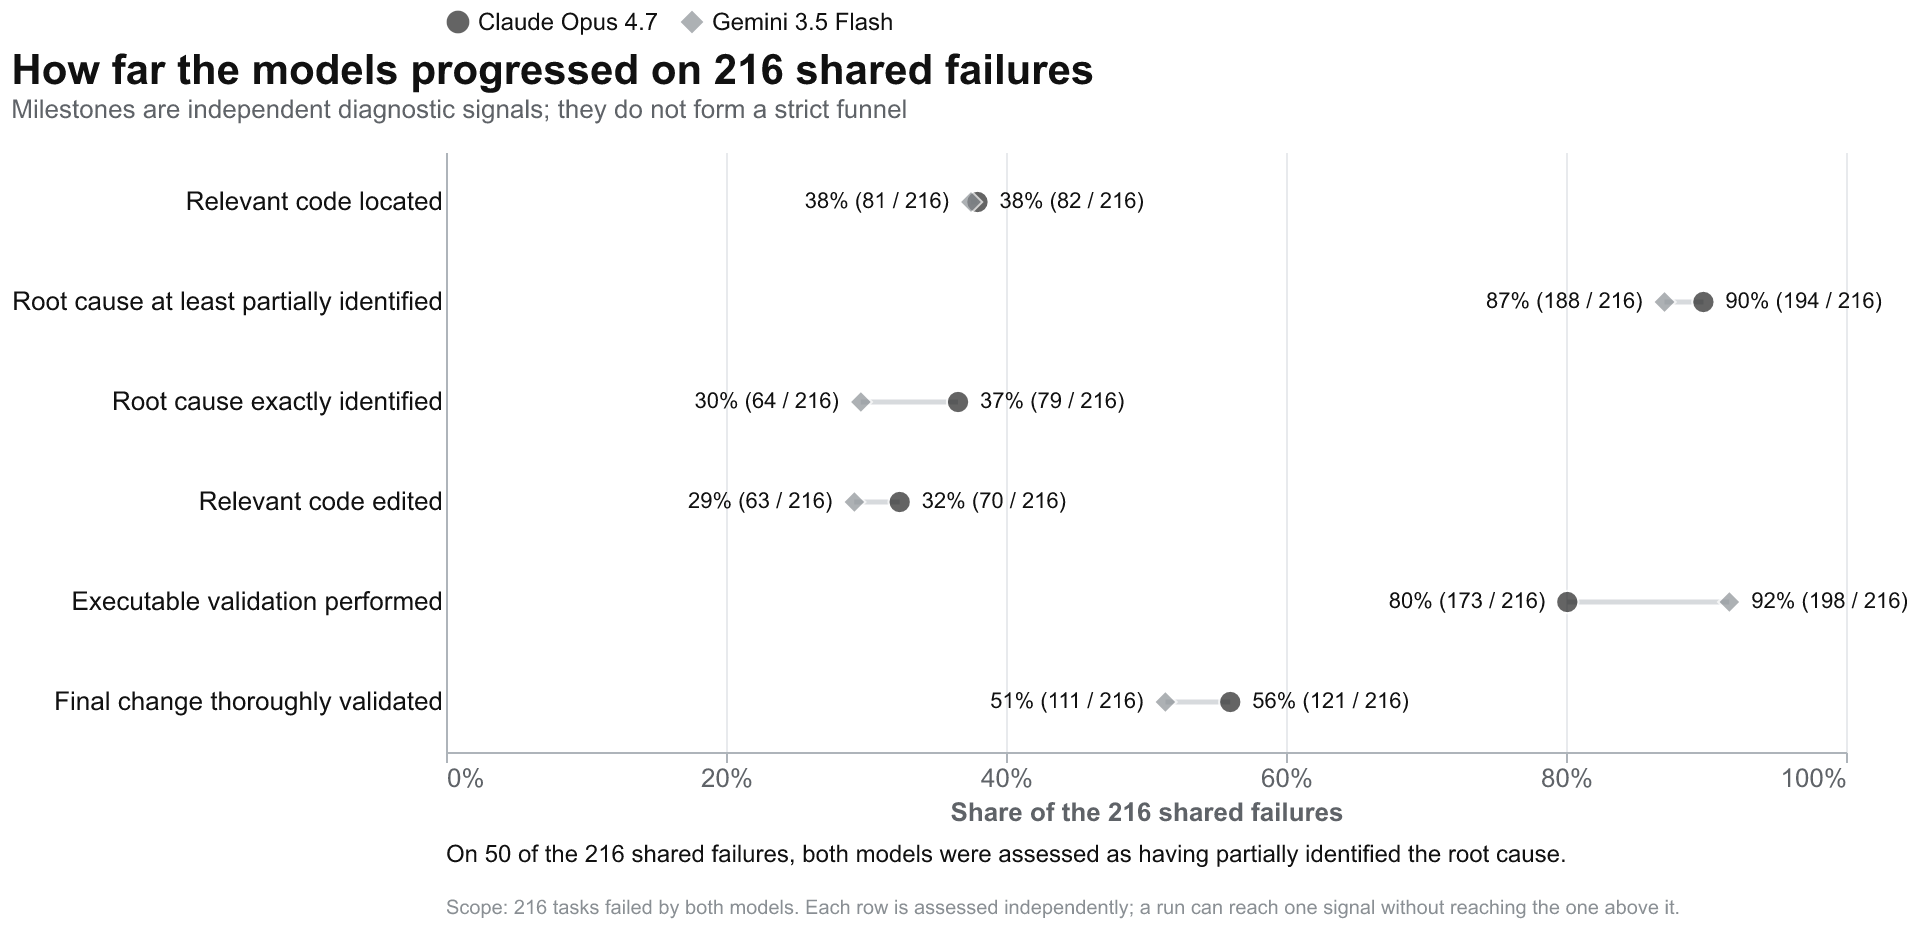
For both models more than 85 percent were assessed as having at least partially identified the root cause. For example, in one task, both agents recognized that text exceeding a token limit caused the error, but truncated the text instead of splitting it into valid chunks. In another, both corrected a faulty download parameter in one code path and missed the same problem in a companion path. A binary failure treats these runs like cases in which the agent never found the relevant component, although they were much closer to a correct solution.
The models were not completely lost. They had reached the relevant mechanism but implemented the fix incompletely, changed the wrong layer, or missed the task’s exact contract.
This is not simply a question of matching the golden patch. The reference solution is useful, but it is not the only possible valid implementation. A candidate may change a different file or architectural layer and still address the same mechanism. Structural comparison therefore needs to be combined with semantic assessments of diagnosis, completeness, and validation.
From leaderboards to model profiles
By using these outcomes it is possible to construct model-specific profiles that give more information about their strengths and weaknesses. In the following we list exemplary ones for Claude Opus 4.7 and Gemini 3.5 Flash.
Claude Opus 4.7: Strong diagnosis, weaker completion
Opus was more likely to identify the underlying cause of ambiguous defects. It often reached the correct mechanism or architectural layer and solved 53 tasks that Gemini missed. These results make Opus a useful starting point when the main challenge is understanding an unfamiliar repository or separating a visible symptom from its source.
The main weakness appeared after localization. Some runs found the right mechanism but stopped with a reproduction test, missed a companion branch or call site, or implemented a plausible custom solution instead of following an existing repository pattern. In 123 runs, Opus performed no executable validation, including 68 runs that still resolved the task. Skipping executable validation means a patch’s correctness is never actually confirmed, so even a resolved task carries undetected risk of regressions or edge-case failures that only running the code would surface.
Overall, Opus’ profile suggests a strong diagnostic model that benefits from an explicit transition to implementation, completion, and testing.
Gemini 3.5 Flash: Stronger validation, weaker grounding, and convergence
Gemini was more likely to run an executable check and use its output to refine the solution. These features were useful when the expected behavior was explicit, the responsible component was reasonably clear, and feedback was readily available.
The main risks we found with Gemini were convergence and repository grounding. Gemini often continued searching after reaching relevant code, repeated equivalent commands, or spent many steps on build infrastructure. It was also more likely to rely on unverified APIs, dependencies, paths, or test fixtures: 195 of its runs, or 37.3 percent, were assessed as containing moderate or severe hallucination, against 130 runs for Opus. Some patches expanded beyond the issue or included unrelated artifacts, and 80 runs, or 15.3 percent, showed significant or severe redundancy, more than twice the Opus rate of 6.5 percent.
Overall, Gemini benefits from precise task contracts, symbol verification, clear stopping rules, and a final review of the diff.
A Wider set of models
We also ran the pipeline over a wider set of models. We evaluated GPT-5.5, Claude Opus 4.7, Gemini 3.5 Flash, and Qwen 3.6 27B FP8 on the same four benchmark datasets, and the table below compares them on the 522 tasks all four of them share. The same four perspectives separate them as well: GPT-5.5 reached the highest resolve rate at 51.5 percent and was the only model that always ran an executable check, Opus led every patch quality metric, and Qwen 3.6 27B FP8 resolved 38.9 percent of the tasks at three percent of GPT-5.5’s cost per run.
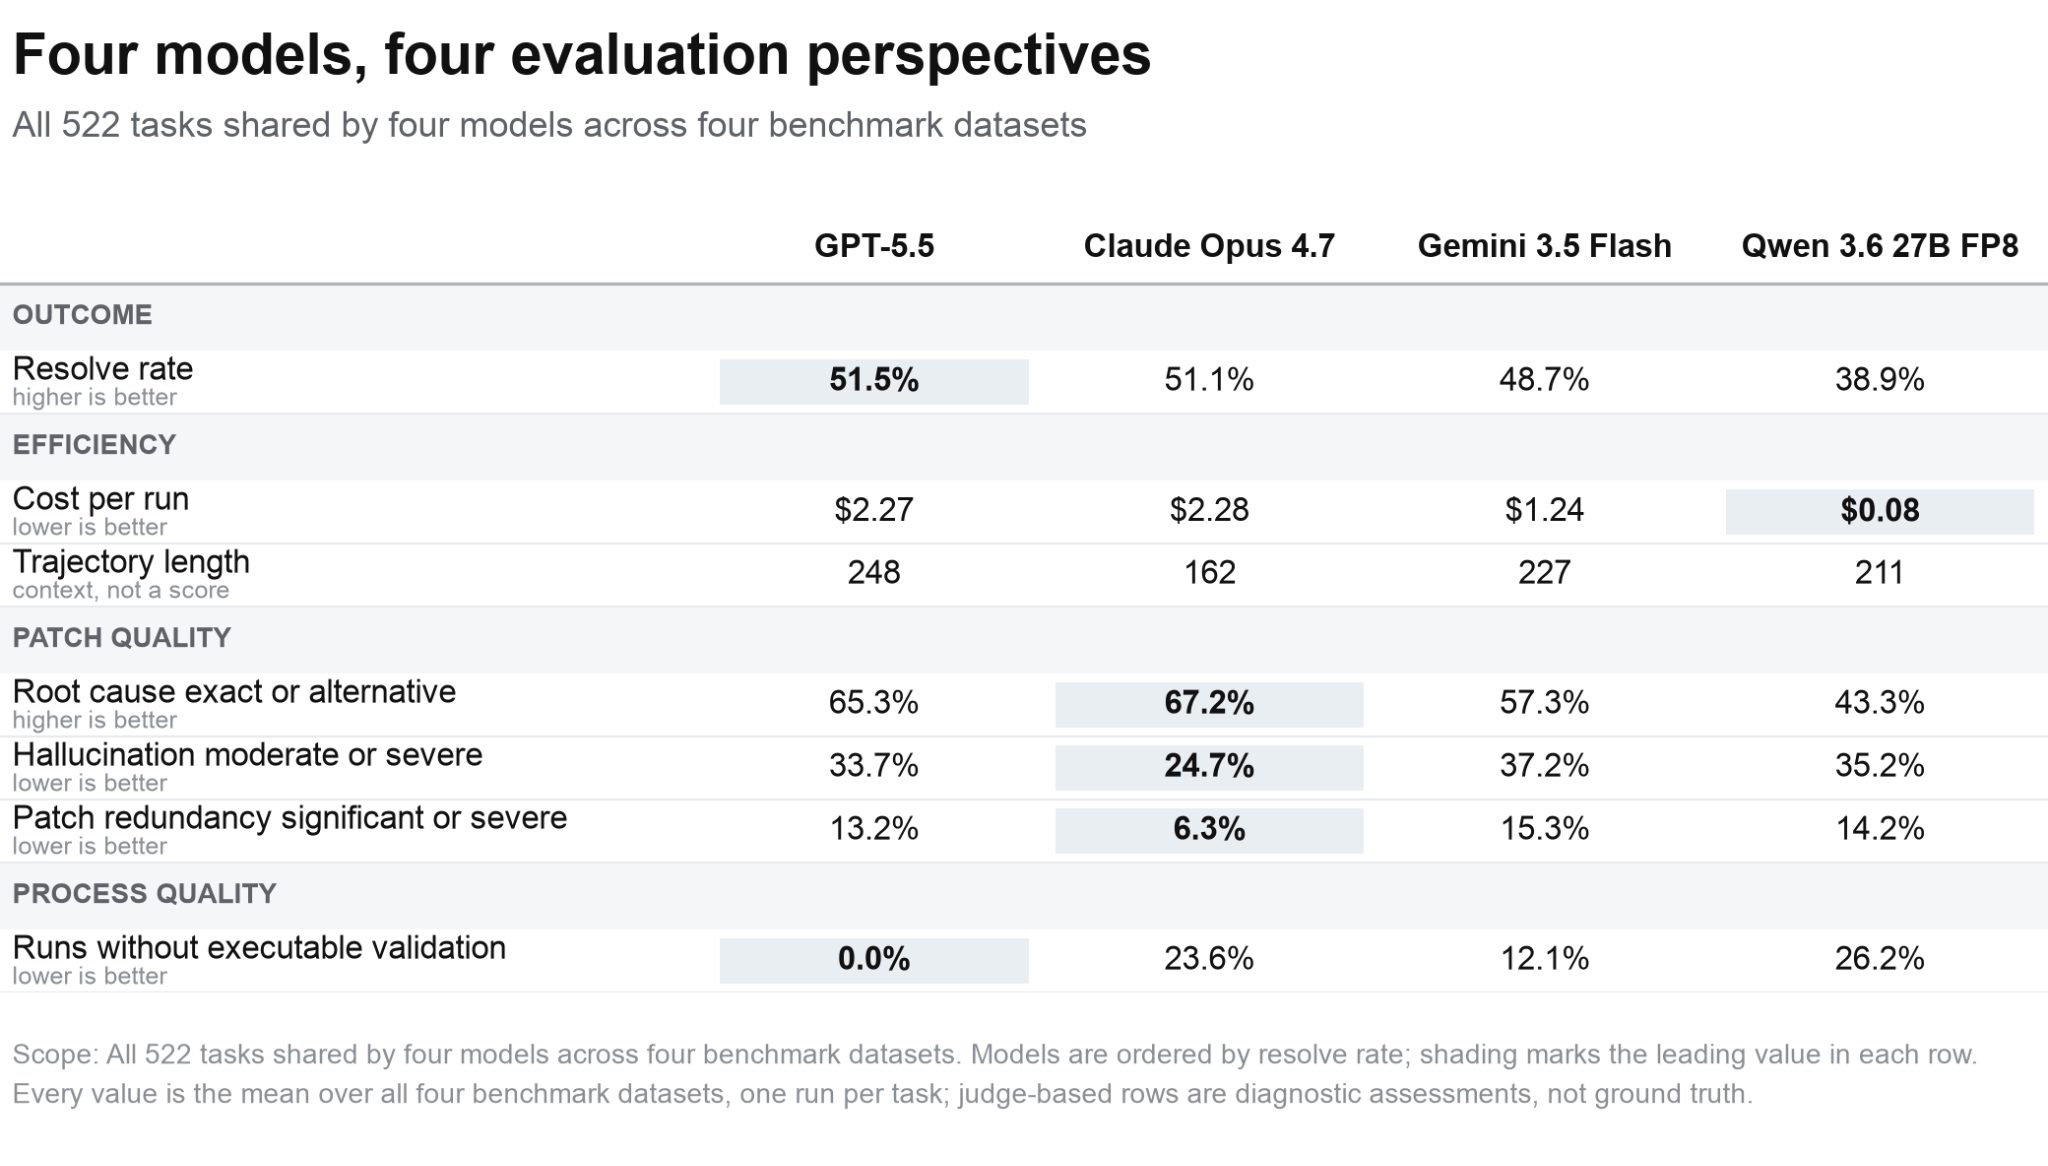
GPT-5.5 and Opus finish four tenths of a point apart on resolve rate and within a cent of each other per run, so a leaderboard would treat them as interchangeable. Their patches are not: Opus was assessed with moderate or severe hallucination in 24.7 percent of its runs against 33.7 percent for GPT-5.5, and with significant or severe patch redundancy in 6.3 percent against 13.2 percent, while producing the shortest trajectories of the four models. What GPT-5.5 offers in return is process discipline, since it never ended a run without an executable check while Opus skipped validation in 23.6 percent of its runs.
Qwen 3.6 27B FP8 is a third kind of trade-off: 12.6 points behind on resolve rate and the weakest of the four at identifying the root cause, but inexpensive enough that a failed run costs little. Which model is preferable therefore depends on whether the expensive part of the work is diagnosis, patch review, or the run itself.
Limitations and conclusions
In this post, we inferred profiles for Claude Opus 4.7 and Gemini 3.5 Flash. These inferences are based on a specific Junie scaffold used in this evaluation, and they should not be used to generally describe the model themselves. Moreover, The LLM judge assessments are diagnostic signals rather than ground truth, and are heavily based on a single golden patch, which in most cases, as typical in the coding domain, is not the only viable solution. The judges may be therefore inclined to score negatively valid solutions if they differ from the reference one.
Resolve rate remains the foundation of coding agent evaluation, but it becomes more useful when paired with evidence about efficiency, patch quality, and process. Our overall goal is not to replace a leaderboard with another aggregate score. We would like to understand what produced each result and use those patterns to improve model selection, prompting, and agent design. From an industry perspective we can better refine agent design, by moving beyond aggregate success rates to fine-grained scores and behavioral profiles. On the other hand, from a user perspective, we can now empower Junie users to choose the right model for the job.

 点赞
点赞 收藏
收藏 点踩
点踩 分享
分享