OpenTelemetry Comes to IntelliJ IDEA, GoLand, PyCharm, and WebStorm

OpenTelemetry Comes to IntelliJ IDEA, GoLand, PyCharm, and WebStorm.
The OpenTelemetry plugin has broken out of the confines of JetBrains Rider. No sandbox exploit was involved – this escape was planned by our developers. With the 2026.2 release, the OpenTelemetry plugin is now available in IntelliJ IDEA, GoLand, PyCharm and WebStorm. Rider users needn’t worry – it still works there too.
The plugin brings logs, metrics, traces, and the service map from local applications into the IDE. You can inspect them without setting up a separate local observability backend.
Get the OTel plugin from the Marketplace
What is the OpenTelemetry plugin?
While developing with your IDE, you can use the plugin to:
- Find what happened immediately before an error.
- See which services and dependencies a request reached.
- Pinpoint where a request spent its time.
- Check whether the application emitted the expected logs, metrics, and traces.
- Ask your coding agent to do all of the above via MCP.
The plugin’s functionality complements what the IDE offers out of the box. Use a debugger to step through code, a profiler to analyze performance, and a production monitoring platform to watch deployed systems. Use the OpenTelemetry plugin to inspect runtime behavior while you build or test the application.
Imagine this
Say you are testing a feature that calls several services and a database before publishing a message to a queue. The request fails, and the console shows the exception, but not the path that led to it.
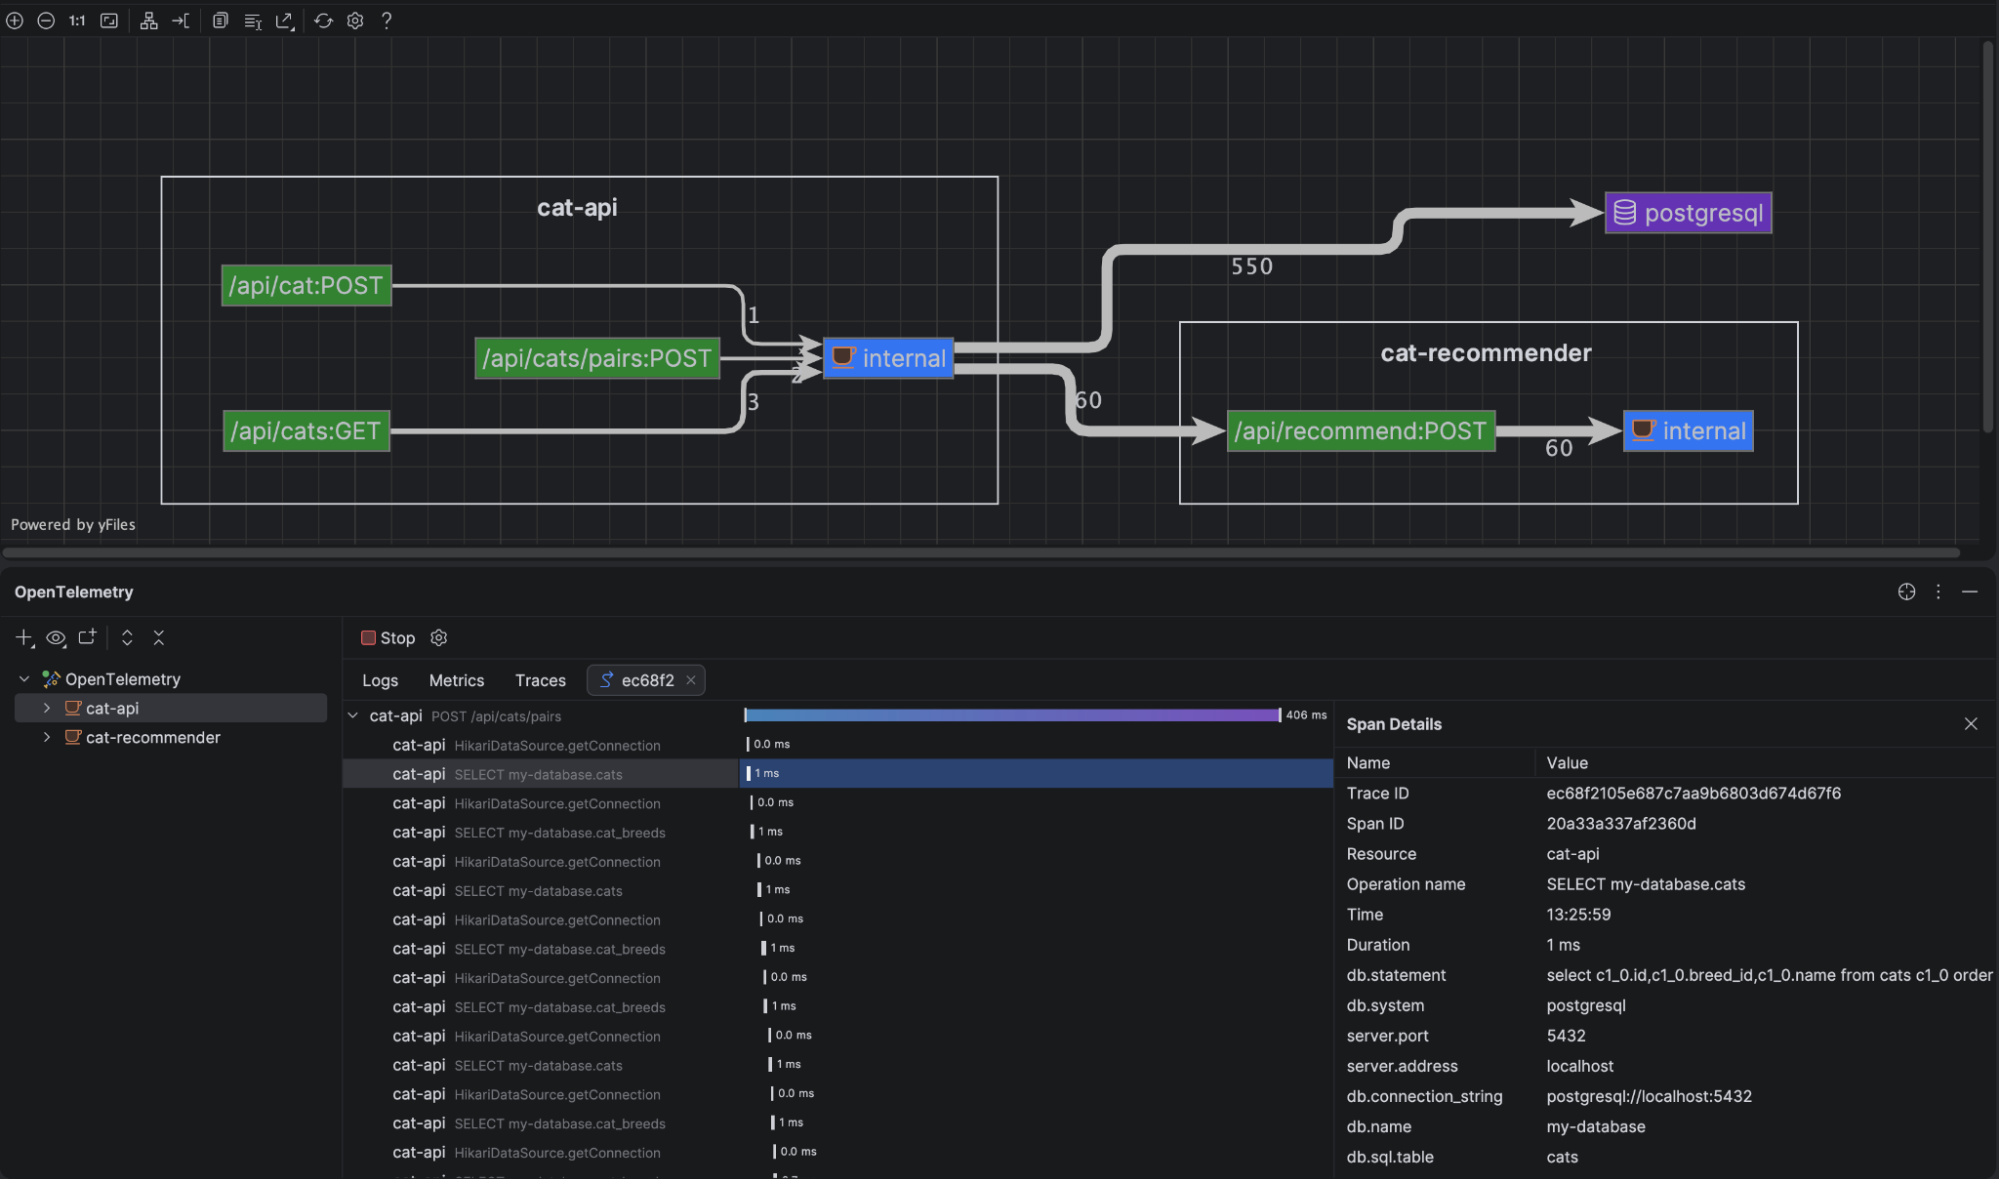
In the OpenTelemetry tool window, you can search the logs for the error. Open the relevant trace to see how the request moved through the system and where it failed. The Service Map shows the services and infrastructure involved.
Explore runtime data in the IDE
Search and inspect logs
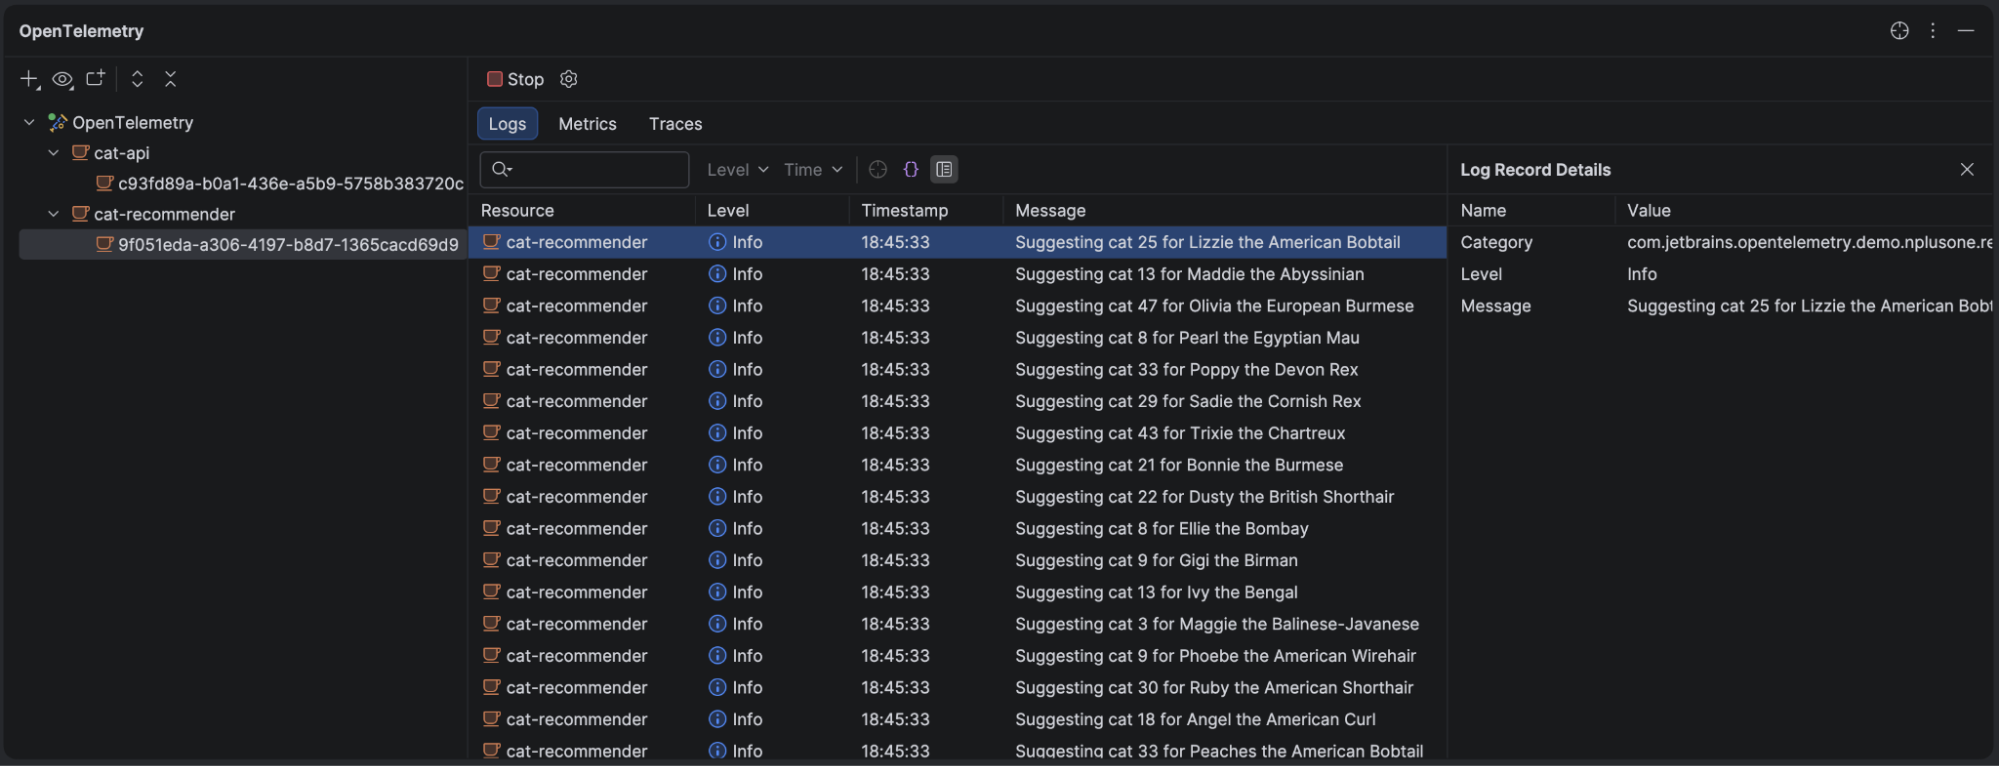
Console output is manageable until several services start writing at once. The Logs view puts OpenTelemetry log records in a searchable table. You can filter by severity or content, then open a record to inspect its attributes.
Check metrics
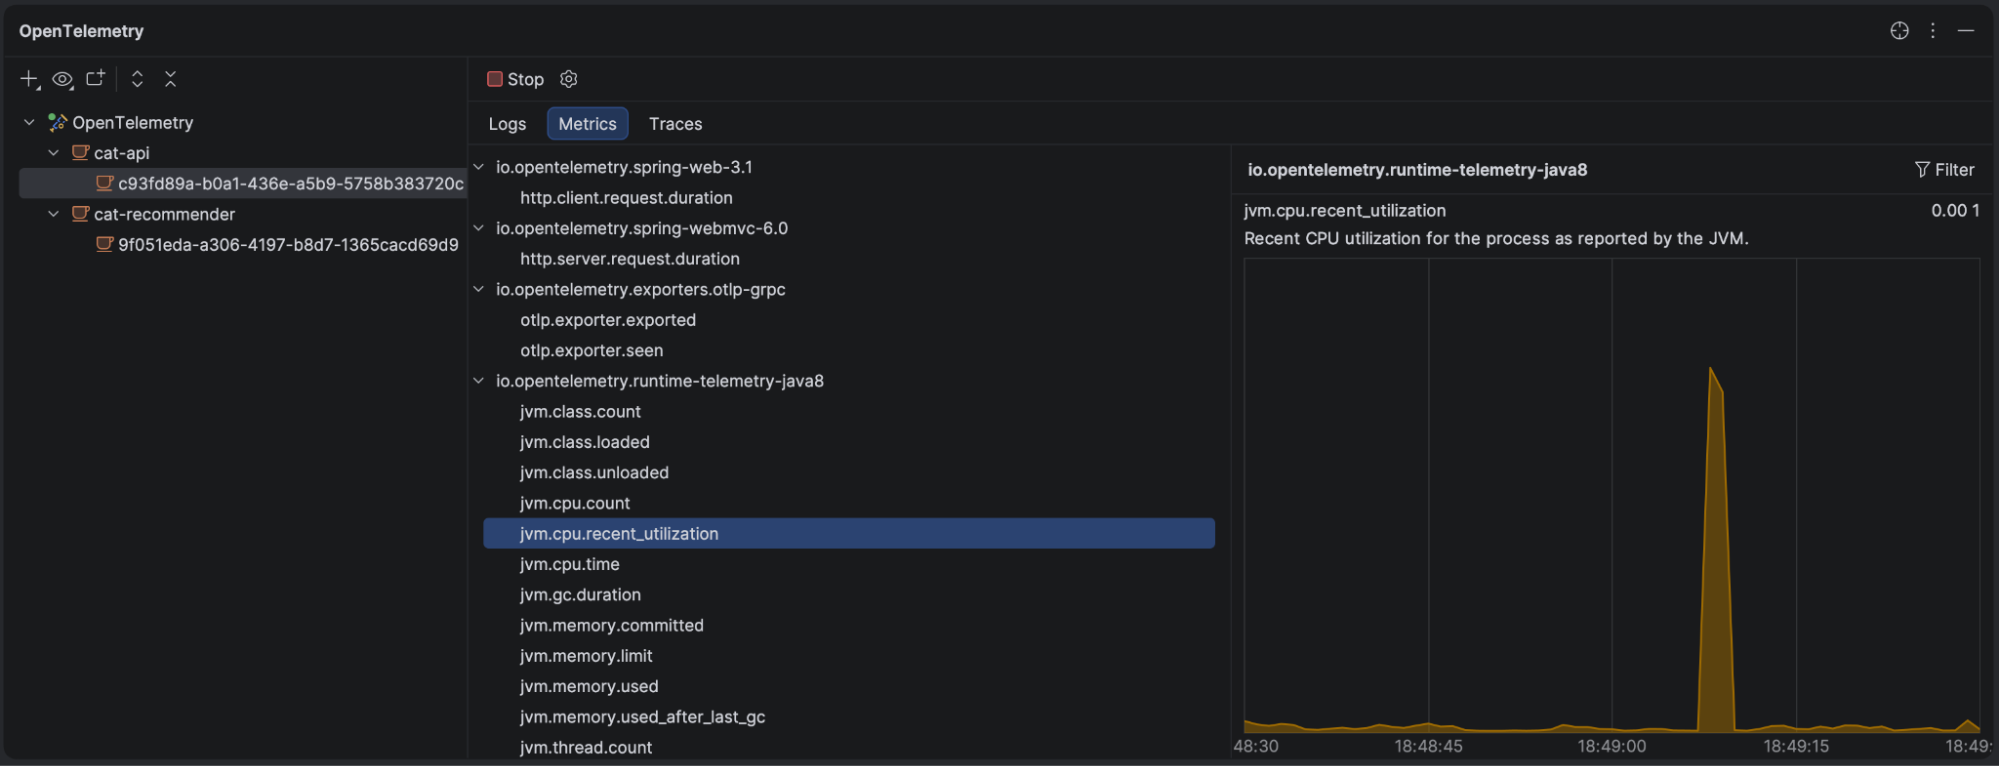
Select a metric from the metric tree to plot its values while you use the application. This view is not a replacement for your production dashboards, but it lets you inspect what the application will export before you send the data to a production observability platform. If a new library adds noisy or unnecessary metrics, you can catch them locally and adjust the instrumentation before your DevOps and SRE colleagues have to handle them.
Follow a request through its trace
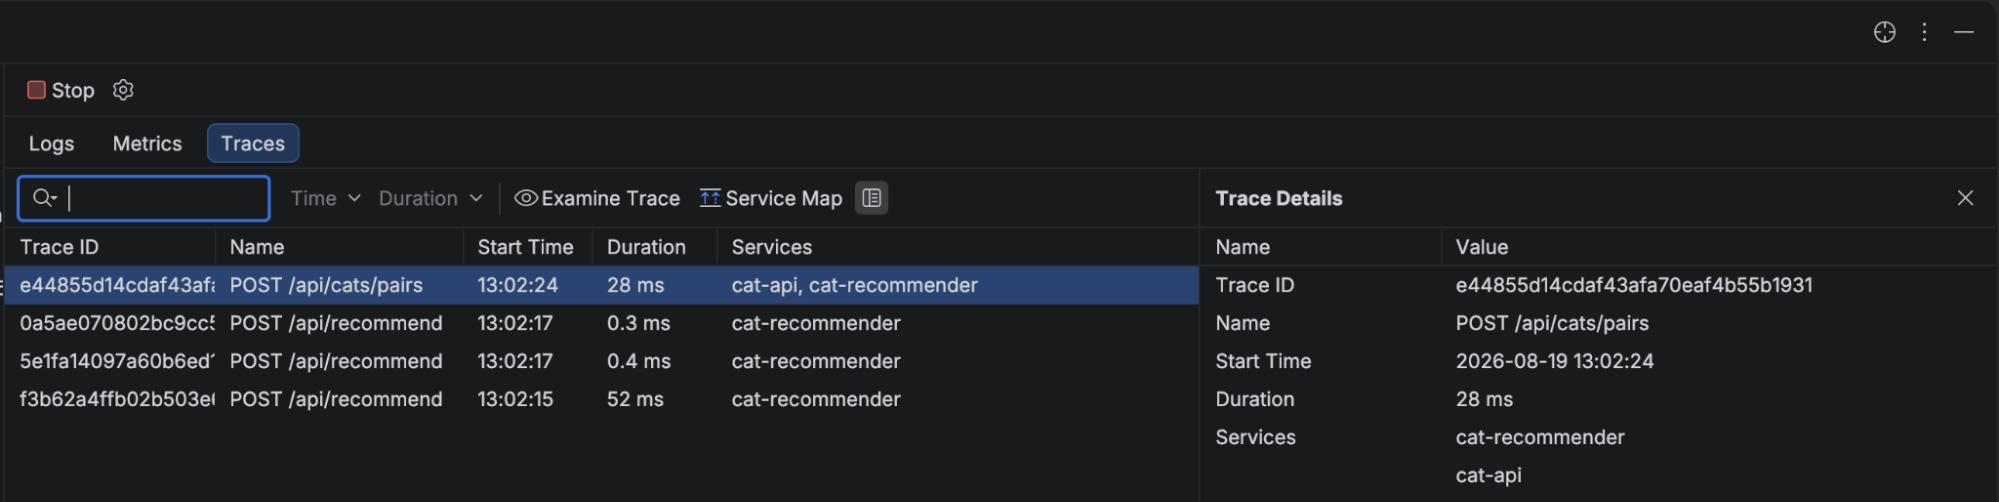
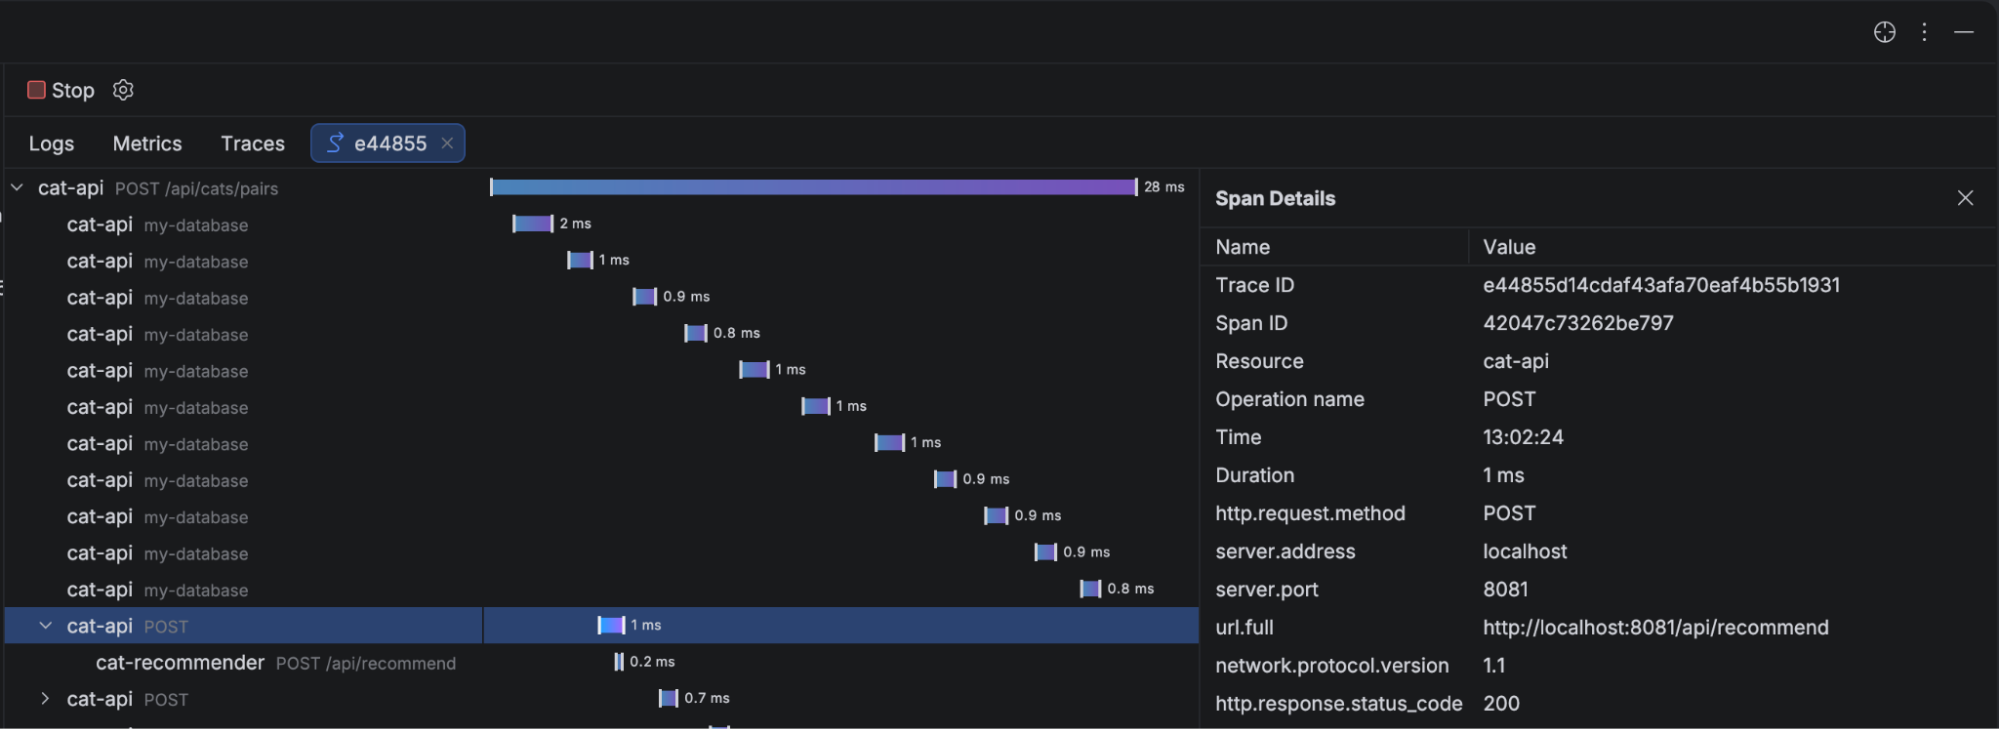
Open a trace to see its spans across services. Each span includes timing and attributes, so you can follow the request from start to finish and zero in on the operation that failed or slowed things down. Development is also a good time to look at the trace itself. Does it contain the spans and details you’d need during a real incident? It’s much easier to fix those gaps now than to discover them in production.
See observed relationships in the Service Map
Architecture diagrams go stale. The Service Map builds its relationships from collected traces, so it reflects the traffic the plugin has seen between services, endpoints, databases, and message queues.
Expected one HTTP call or database query, but the diagram shows several? Finding that during development gives you time to fix it before release.
Connect an instrumented application
The plugin does not add OpenTelemetry libraries or agents to your application. It configures where an already instrumented application sends its data.
Start an instrumented Java, Python, Go, or .NET application from a supported IDE run configuration, and the plugin passes OpenTelemetry Protocol (OTLP) environment variables that point to its built-in receiver. It passes the same variables to new integrated terminal sessions.
You can also point the application’s OTLP exporter at the endpoint shown by the plugin. If you already use a local OpenTelemetry Collector, add the plugin as an OTLP destination and keep the rest of your pipeline.
Runtime context for coding agents
The plugin has experimental MCP support through the JetBrains MCP server. A compatible coding agent can query the telemetry collected in the IDE with these tools:
get_log_recordsget_spansget_servicesget_service_map
These tools give the agent evidence from a particular run, so that it can inspect the logs and spans or query the observed service relationships.
Getting started
- Install the OpenTelemetry plugin from JetBrains Marketplace for your favorite IDE.
- Instrument your application with OpenTelemetry libraries or agents.
- Start it from a supported IDE run configuration or a new integrated terminal session. The plugin will pass the OTLP environment variables. Alternatively, point the application’s exporter or your local collector at the endpoint shown by the plugin.
- Open the OpenTelemetry tool window and exercise the part of the application you want to inspect.
The plugin shows the signals it receives. If your application exports only traces, the Logs and Metrics views stay empty.
Full setup instructions are available in the OpenTelemetry plugin documentation.
Install it and tell us what you find
Get the OTel plugin from the Marketplace
Try it on a real project, then tell us in the comments or through the issue tracker what worked and what still sent you to another tool.

 点赞
点赞 收藏
收藏 点踩
点踩 分享
分享