Switched to lightweight monitoring stack (from Grafana and Prometheus)

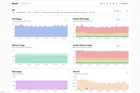
Hey guys. Just a quick review after replace my monitoring apps I run a homelab with multiple hosts (4 Servers, ARM SBCs and x86s) and monitoring was a necessity I started with Grafana, Prometheus (and node exporter, cAdvisor) and used it well. But I found myself spending more time on managing dashboards. Started from presets, and at some point it felt like overkill. and also they are quite heavy for my homelab before Grafana, Prometheus, Node exporter, cAdvisor, after Beszel, Dockhand, beszel agent, hawser(node proxy for dockhand) Built-in dashboards are quite good for general use. All after that I got free memory space around 1GB so I think it's worth it But there's trade-off too. now I got separate dashboards so I had to type different URLs. Both support SSO in free tier, but I'm a single user so I didn't bother setting that up. and I still have no idea what to replace loki with if I need logging. any recommendations? This is not the right answer for everyone. It's good because I am a single user on a personal homelab. If I had a team, I would have built a unified Grafana setup instead haha. and It's not an ad or marketing or anything. Just wanted to share my experience for anyone looking into lighter options

 点赞
点赞 收藏
收藏 点踩
点踩 分享
分享