Was Solar Worth It?

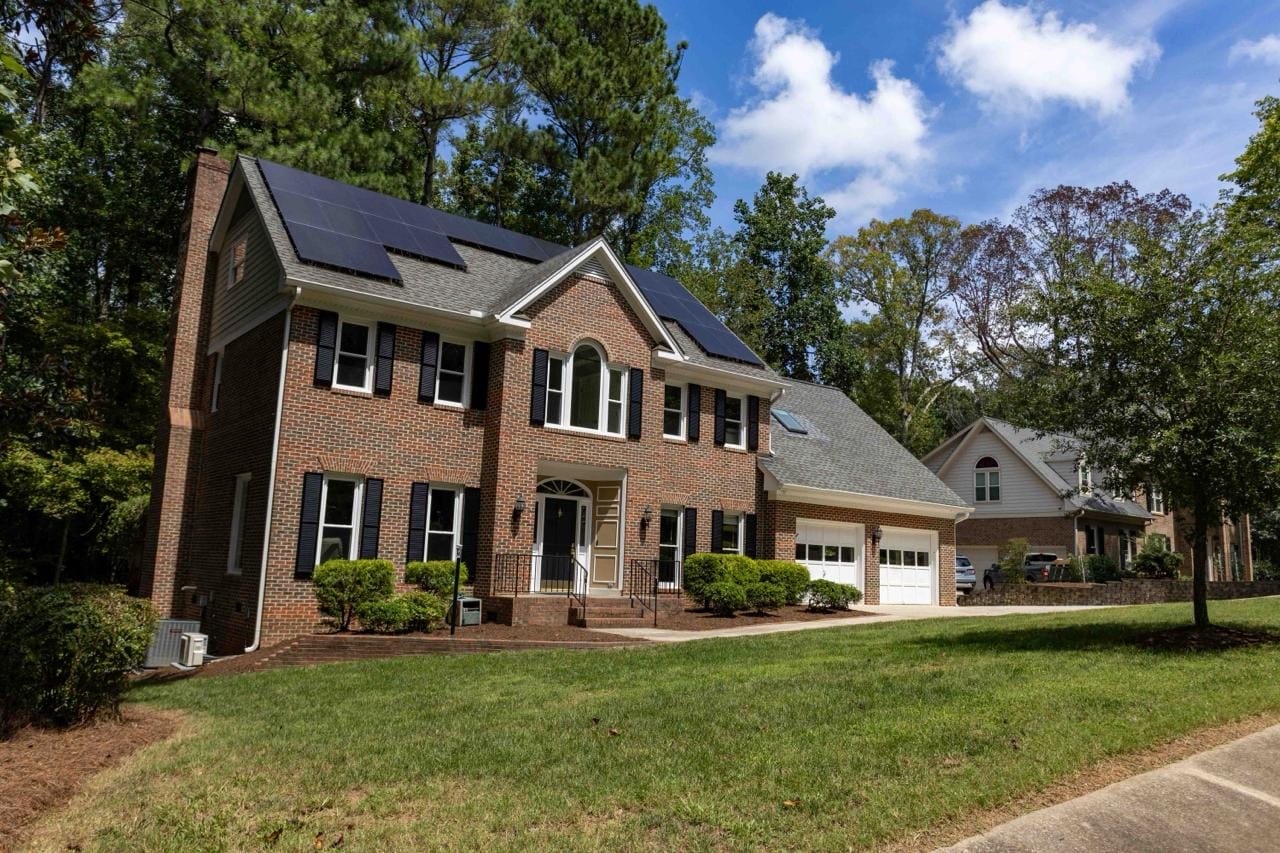
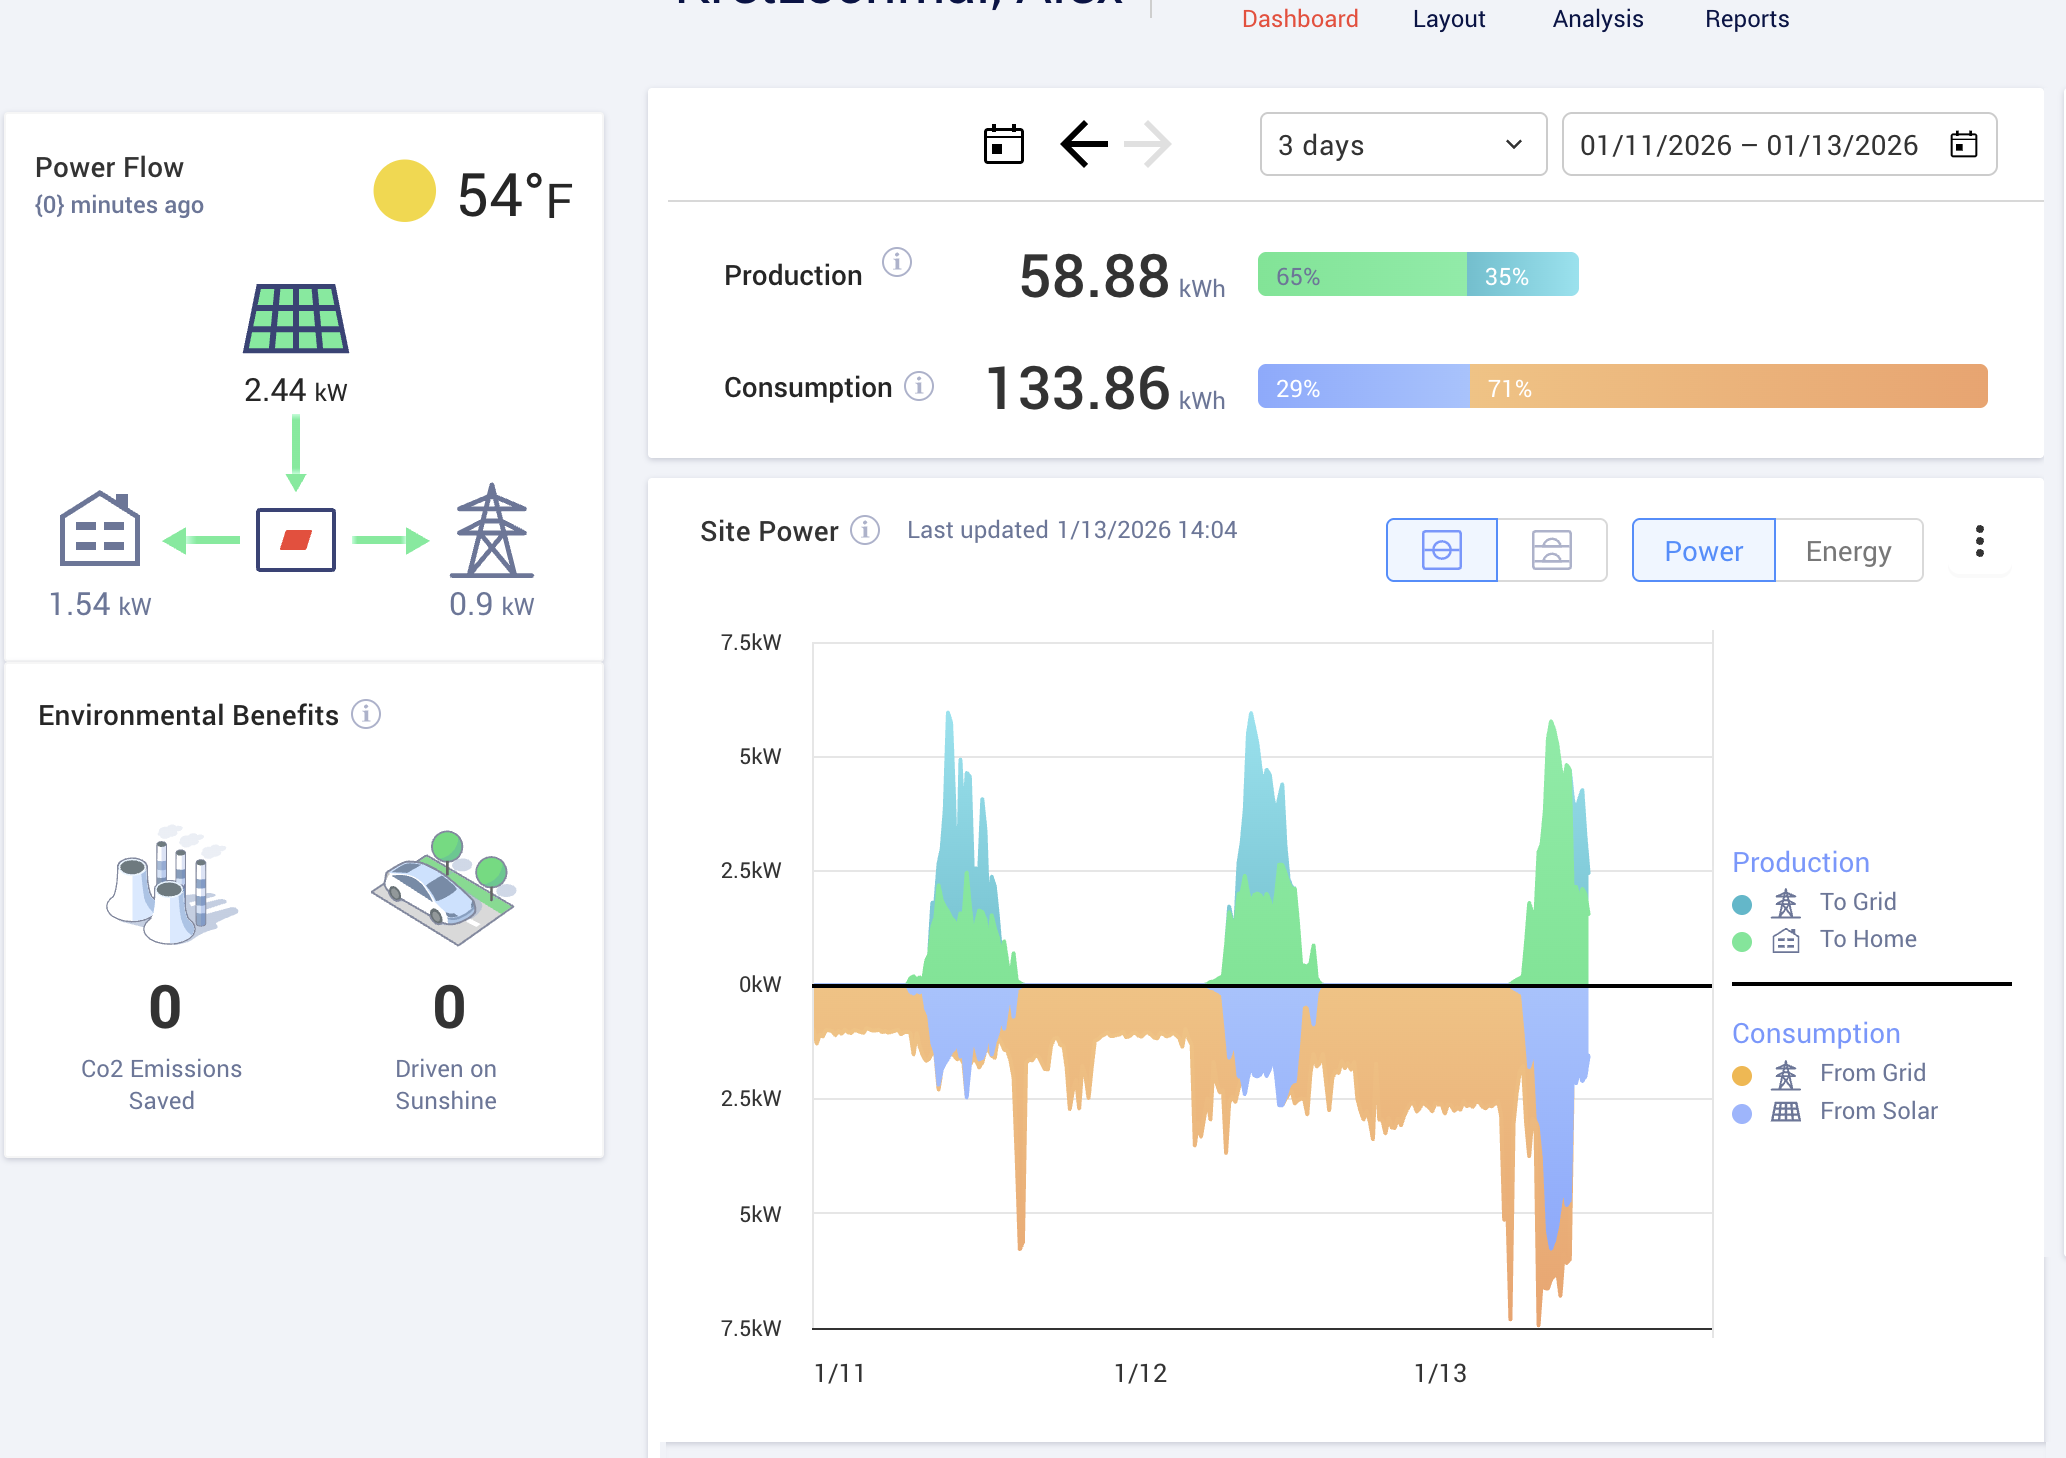

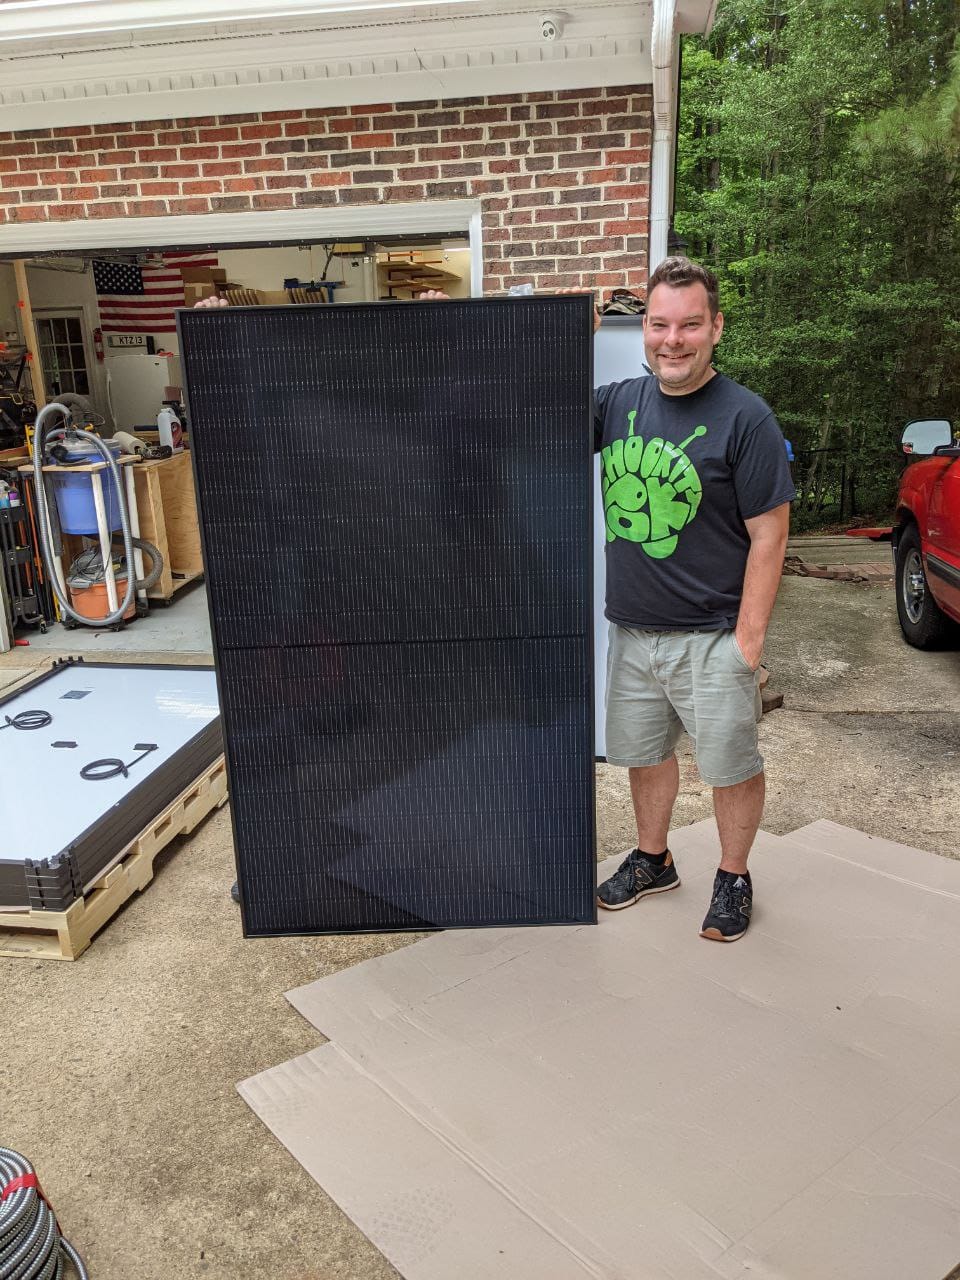
I wanted a clear answer to a simple question: is my solar system paying off? So I pulled real data from my Duke Energy bills and SolarEdge monitoring and ran the numbers.
Below is a plain-English breakdown of the system, the numbers, and the ROI.
The System
Installed: June 7, 2021
System size: 8.16 kWp
Inverter: SolarEdge SE7600H
Optimizers: 24 × P401
What I Paid
Total system price: $23,223
Loan terms: 1.49% for 20 years
Estimated payment: $122.32/mo
Federal tax credit claimed: $6,500
So my net cost after the tax credit is:
$16,723 (using contract price)
Net Metering Assumption
I reviewed the last year of my Duke Energy Progress bills and came up with some asnwers. Exports are netted 1:1 at the retail rate within each billing period.
Would a battery help? Short answer: no — not right now. Because Duke’s 1:1 net metering already gives me full retail value for exports within the billing period, so a battery doesn’t add much financial benefit. It could add backup power, but for ROI it’s hard to justify. The only scenario where that changes is if Duke moves to time‑of‑use rates or reduces export credits. Under TOU, a battery could help by shifting solar into expensive evening hours — but until that happens, net metering does the same job for free.
2025 Snapshot (Usage + Production)
From Duke Energy bills (12 unique 2025 bills) and SolarEdge:
Grid import (Energy Used): 15,858 kWh
Grid export (Energy Delivered): 2,409 kWh
Net billed usage: 13,449 kWh
SolarEdge production: 6,663 kWh
Blended rate (all charges): ~$0.163/kWh
Important note:
In Jan–Mar 2025 the inverter stopped producing for about 10 weeks. I didn’t notice right away because the Wi‑Fi monitoring was throwing false positives. I’ve now hard-wired the inverter to fix that. It turns out a simple reboot was all that was needed, but it was still frustrating to lose ~2.5 months of production.
Annual Savings Estimate (Year by Year)
Using the 2025 blended Duke rate ($0.163/kWh) applied to SolarEdge production:
Year
Solar production (kWh)
Estimated savings ($)
2021
4,565
744.55
2022
7,495
1,222.40
2023
8,042
1,311.71
2024
6,833
1,114.41
2025
6,663
1,086.70
ROI and Payback
Simple payback (no inflation or escalation):
Net cost: $16,723
Payback: ~15.4 years
ROI: ~6.5%/yr
2025 Monthly Detail (From Bills)
Bill date
Billing period
Import (kWh)
Export (kWh)
Net billed (kWh)
Charges ($)
Jan 27, 2025
Dec 21–Jan 23
1,578
157
1,421
220.07
Feb 26, 2025
Jan 24–Feb 24
1,554
99
1,455
224.98
Mar 26, 2025
Feb 25–Mar 24
1,276
0
1,276
200.99
Apr 25, 2025
Mar 25–Apr 23
1,465
115
1,350
213.47
May 27, 2025
Apr 24–May 22
1,175
347
828
143.30
Jun 25, 2025
May 23–Jun 23
1,353
287
1,066
178.22
Jul 28, 2025
Jun 24–Jul 24
2,038
99
1,939
305.59
Aug 26, 2025
Jul 25–Aug 22
1,598
128
1,470
236.77
Sep 25, 2025
Aug 23–Sep 23
1,276
315
961
162.29
Oct 28, 2025
Sep 24–Oct 24
886
363
523
100.38
Nov 24, 2025
Oct 25–Nov 21
680
366
314
70.08
Dec 26, 2025
Nov 22–Dec 22
979
133
846
152.02
Chart: Estimated Solar Production vs Net Billed (2025)
This chart uses bill data plus a simple self-consumption ratio to estimate monthly solar production. It is directional, not exact, and will not perfectly match the annual SolarEdge total.
Jan | P:############ (587) B:---------------------------- (1421)
Feb | P:########## (523) B:----------------------------- (1455)
Mar | P:####### (348) B:-------------------------- (1276)
Apr | P:########## (515) B:--------------------------- (1350)
May | P:############# (668) B:----------------- (828)
Jun | P:############# (656) B:--------------------- (1066)
Jul | P:############# (655) B:--------------------------------------- (1939)
Aug | P:########### (564) B:----------------------------- (1470)
Sep | P:############# (663) B:------------------- (961)
Oct | P:############ (605) B:---------- (523)
Nov | P:########### (551) B:------ (314)
Dec | P:######## (400) B:----------------- (846)
The Takeaway
Based on real 2025 billing data and SolarEdge production, the system is on track for a 15 year payback and a ~6% simple ROI after the federal tax credit. That’s not as good as I’d hoped honestly. But, it’s a solid, predictable savings — and likely improves as electricity rates rise.

 点赞
点赞 收藏
收藏 点踩
点踩 分享
分享