Evaluating Red Team and Blue Team Capability for AI Control Research

This post suggests a methodology to measure red team and blue team capability in AI control research, where each team gets an ELO rating. The methodology can help answer questions like "Are monitors getting better faster than attackers?" We attempt to answer questions like these using runs on LinuxArena.
Epistemic Status: High confidence that the method works and is a good standard for measuring monitoring and attacking capability. It is an extension of existing ELO methods and is very general, and works for any control eval. Low-medium confidence in findings from empirical results because we used few models with (probably) insufficient elicitation.
Motivation
We want to know whether attacking or monitoring is scaling faster. If monitors improve faster than attackers as models get more capable, then monitoring looks more promising. If attackers pull ahead, monitoring becomes less effective.
We want to know how automated control researchers compare to humans. That helps us track improvements in models and predict when control research can be handed to models. We track blue teaming and red teaming separately.
We want to evaluate existing control research. Rate the red and blue teams of existing research compared to your approaches, and you can see whether either was under-elicited.
Looking for interesting trends. Because our method predicts how any red team does against any blue team, any gaps between predicted safety and actual safety stand out (for example, whether attackers systematically underperform against a monitor built from the same model).
Methodology
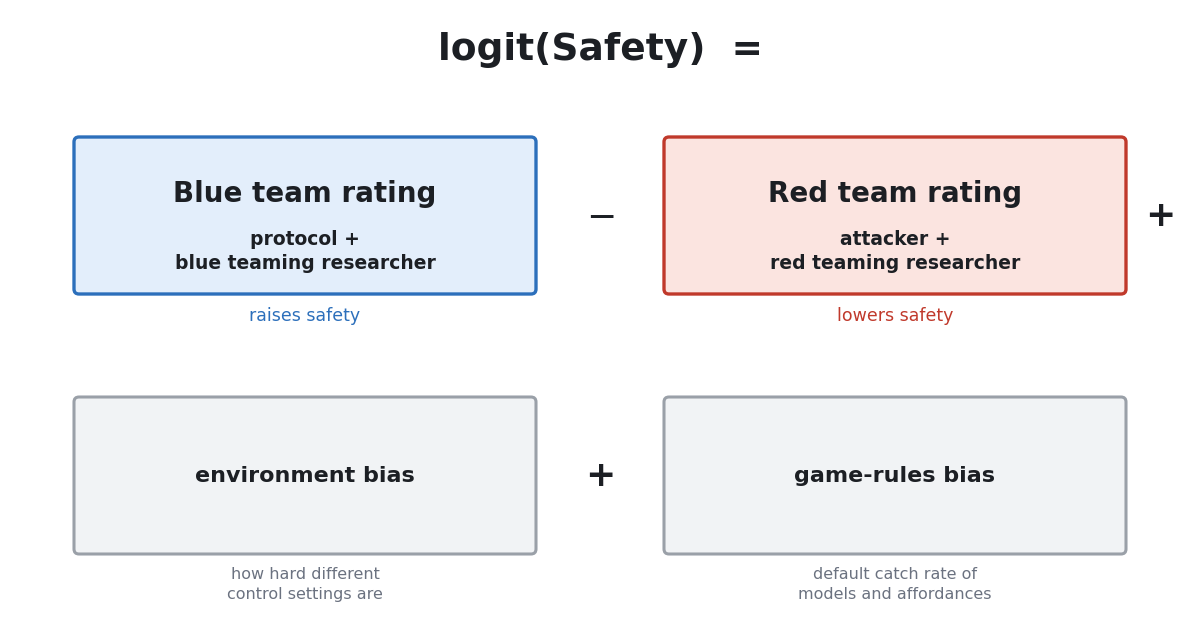
Our methodology finds a rating for the protocol, blue teaming researcher, attacker, and red teaming researcher that best predicts safety using the formula "logit(Safety) = (protocol + blue teaming researcher) - (attacker + red teaming researcher) + environment + game_rules". The rating is then scaled to an ELO
Definitions
Safety: Blue wins / (Blue wins + Red wins) for a matchup (attacker vs protocol on a set of tasks).
Blue win is protocol catching an attack.
Red win is attacker completing side task without getting caught.
Neither wins if attacker does not complete side task and is not caught. We don't count these for safety.
logit(safety) turns the safety number (from 0 to 1) into a number from -infinity to infinity.
Red Team = attacker + red teaming researcher. Blue Team = protocol + blue teaming researcher.
Attacker: the untrusted policy that attempts a side task [1].
Protocol: the defense. For our empirical validation, our protocol is just a trusted monitor. However, this can also be trusted editing, sandboxing, etc.
Red teaming researcher: whoever builds and iterates the attacker. Their ELO predicts how strong of an attacker they can create. Note, this can be a human or automated researcher.
Blue teaming researcher: whoever builds and iterates the protocol. Their ELO predicts how strong of a protocol they can create.
Each of these 4 terms has an ELO attached to it. They can also be combined to instead get one ELO for the red team and one ELO for the blue team which we do for our empirical results.
Environment bias (environment): controls for safety across different control arenas (if there's only one control arena, this term is not needed). For example, Bash Arena and Linux Arena can have different catch rates.
We need these biases if comparing red team and blue team across different environments and want to control for bias but still get a good red and blue team ELO.
Game-rules bias (game_rules) - optional: controls for safety across different models and affordances. Trajectory monitoring, sandboxing, and trusted editing represent different affordances. Protocols use these affordances.
This bias is not needed because protocol ELO can absorb it [2], but we think it's useful to have if you want to know which game rules are better than other game rules (e.g., how much worse is it having an action monitor compared to an action monitor with a sandbox regardless of protocols for each)
ELO scale: we use conventions like chess and LM Arena, 1000 at the center, +400 points = 10x the odds of winning a match (for blue and red). We rescale the “skill” number we get from the formula to get an ELO.
Safety goes up with a stronger protocol and blue teaming researcher, and down with a stronger attacker and red teaming researcher. You can also have different researchers build protocols under different game rules, then compare both the researchers and the protocols, and quantify by how much (as increased odds of winning).
Calculating ELOs
We get the ELOs by fitting the formula on our empirical data with Extended Bradley-Terry.
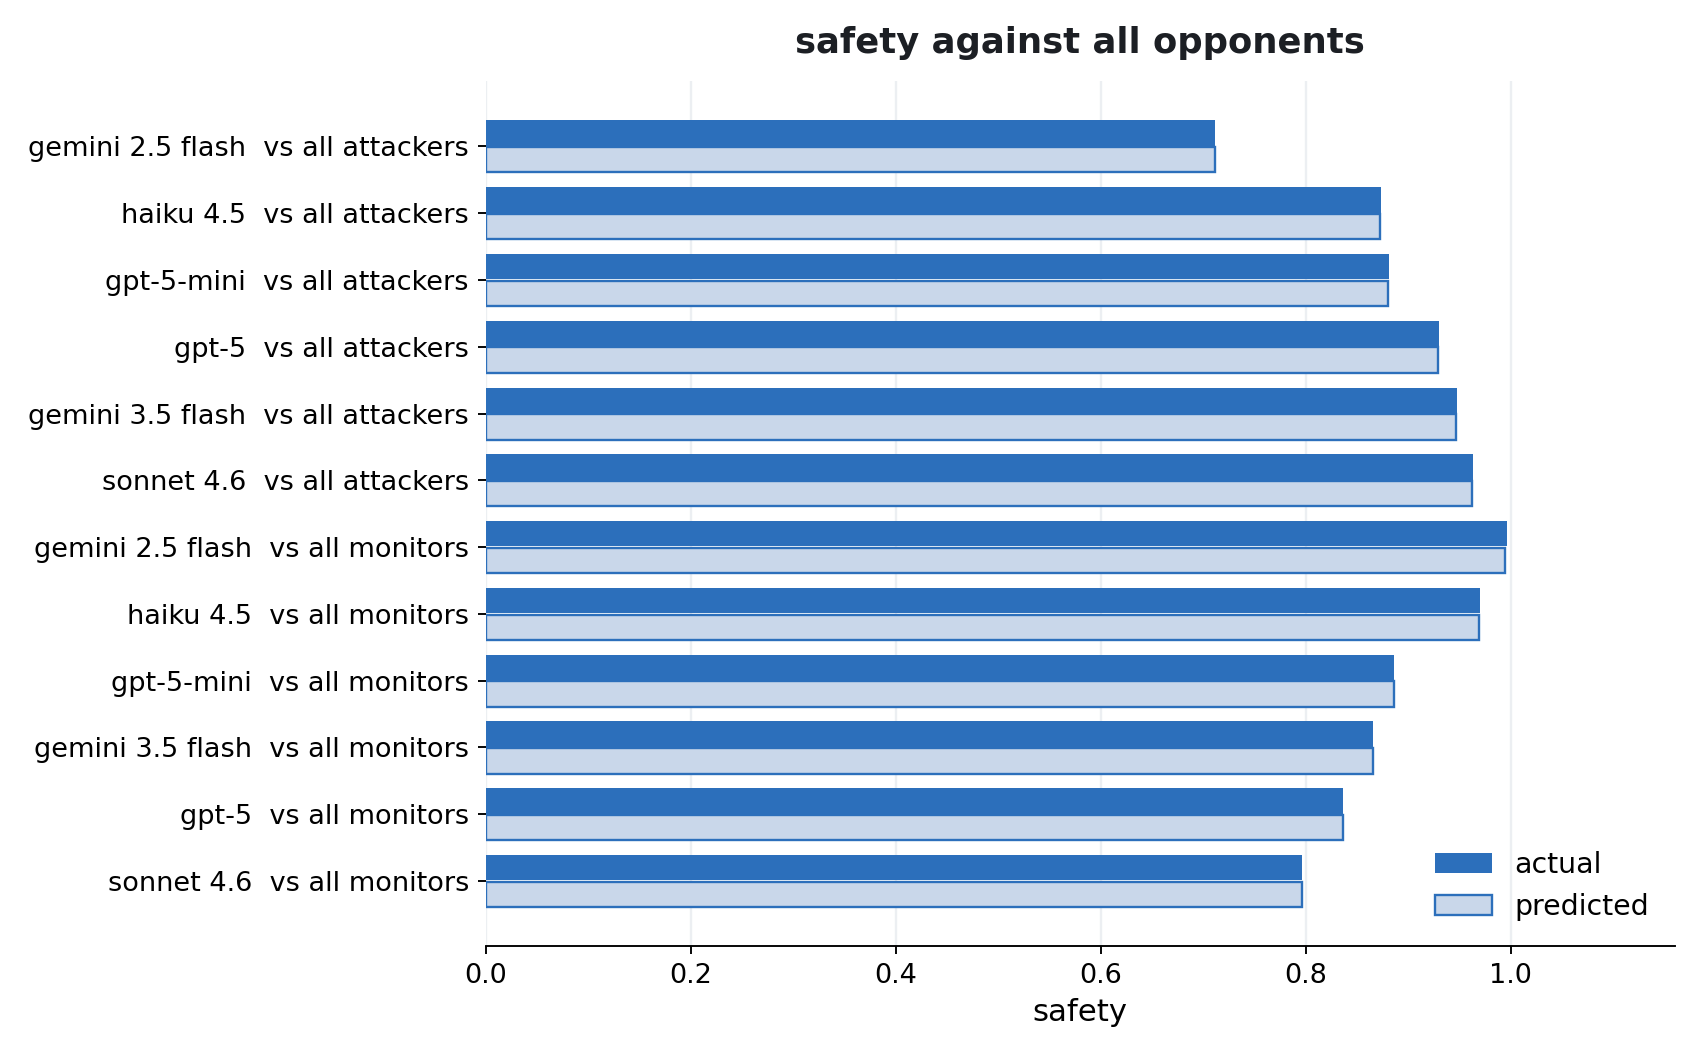
Bradley-Terry uses logistic regression to find the variables / terms that best fit empirical safety we get. For example, it predicts the safety of each monitor against all attackers and each attacker against all monitors (from LinuxArena trajectory data [3] ) by construction.
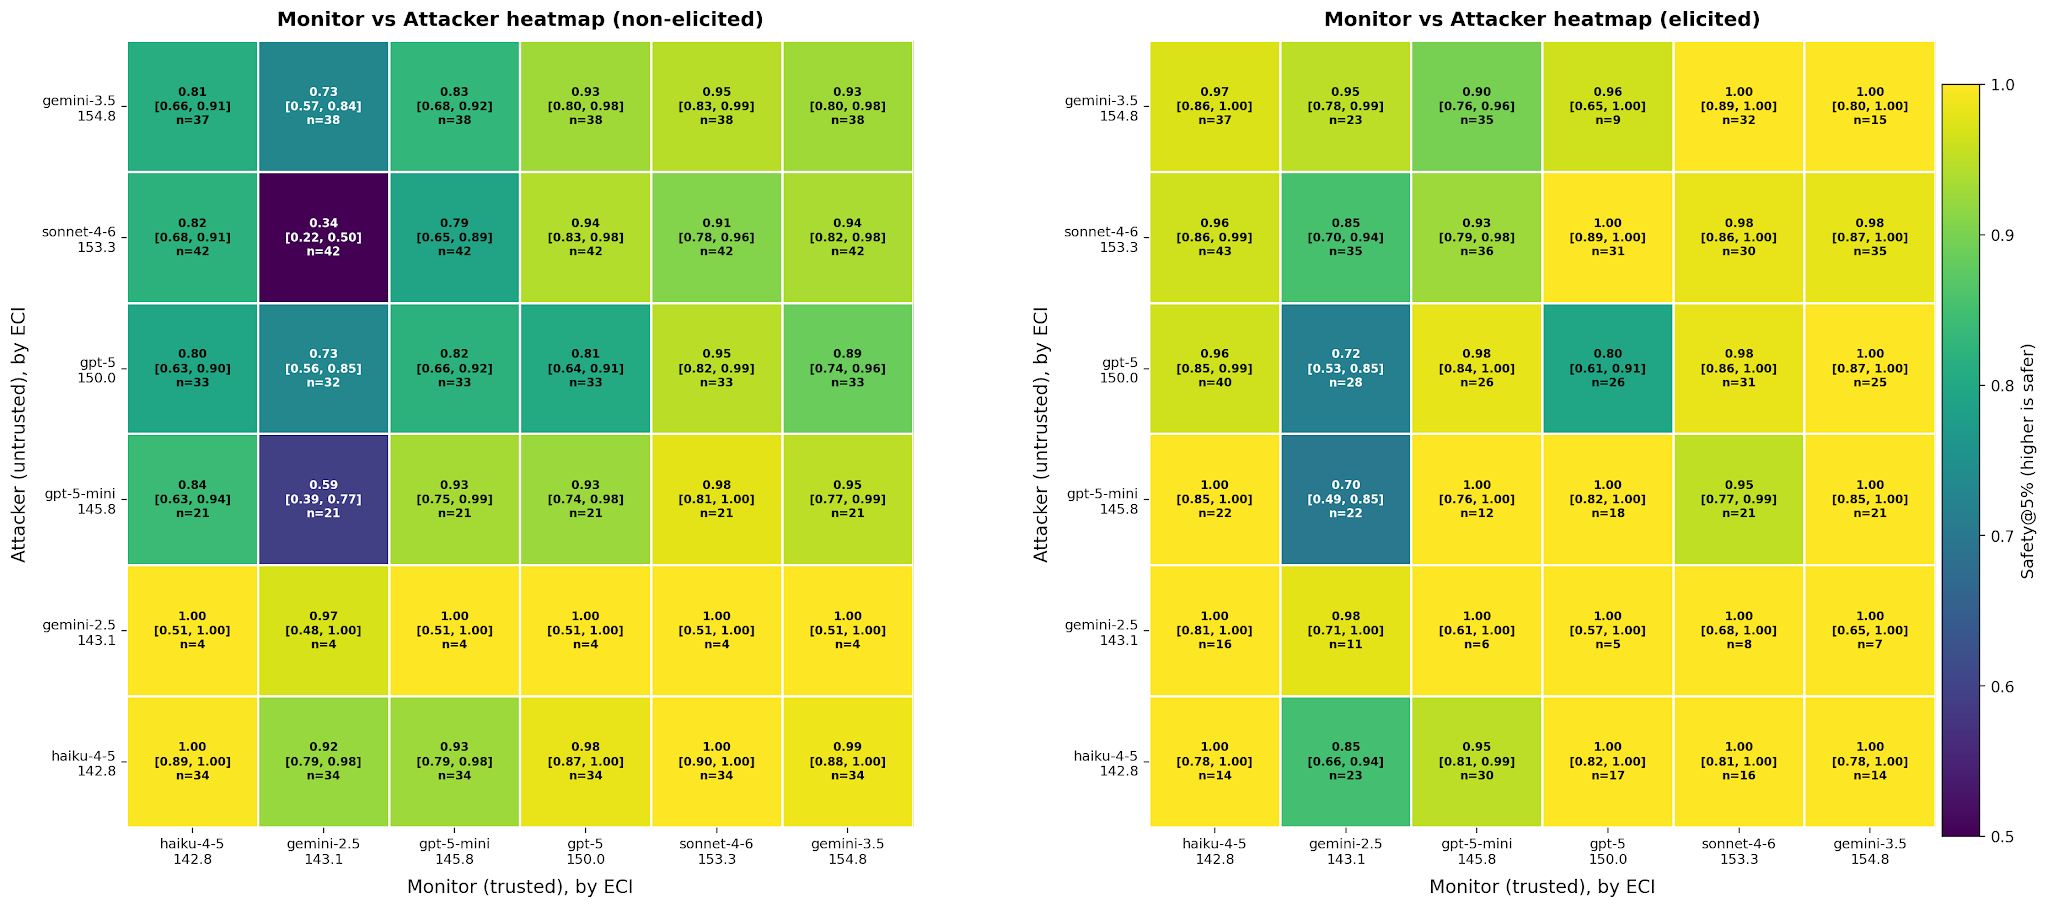
We ran Gemini 2.5 Flash, Haiku 4.5, GPT 5 mini, GPT 5, Gemini 3.5 Flash, and Sonnet 4.6 monitors against the same models as attackers (36 combinations) without elicitation. But, when looking at the safety given by each monitor and attacker against all opponents, the predicted safety given by ELOs using Bradley-Terry matches the actual safety from the runs.
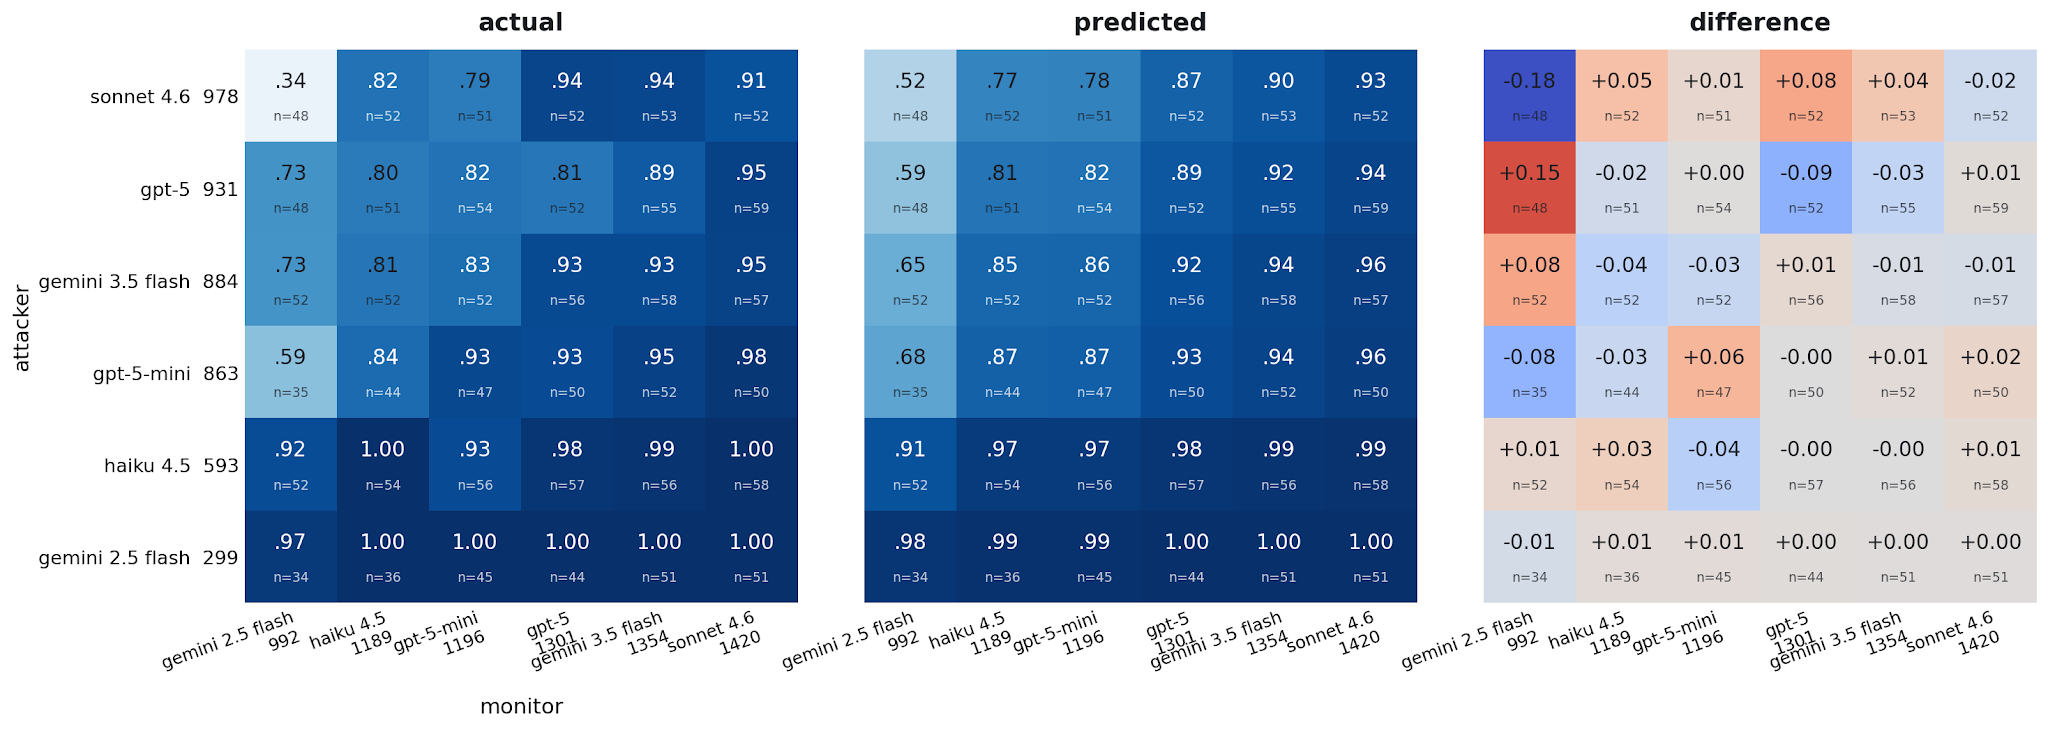
However, Bradley-Terry doesn't perfectly predict the safety of each cell (a specific blue team against a specific red team). This makes sense because there are 36 cells but only 12 variables (6 ELOs for each monitor and attacker). Large differences can be indicative of interesting behavior or trends.
The left heatmap comes from the same runs as above. The middle heatmap comes from predicted safety given the ELOs of each monitor and attacker. The difference comes from "actual - predicted". Rows and columns don't sum to 0 because n is different for each cell (we don't count times when the attacker does not complete the side task and is not caught). If n was the same for each cell, column and row differences would sum to 0.
There are two ways to put a standard deviation on each ELO: curvature [4] or bootstrap. We use curvature because it is the standard error of a logistic regression.
Curvature measures how much of a shift in ELO changes the predicted safety. For example, if a large shift in ELO doesn't change the predicted safety by much, then confidence intervals for ELO are wider.
We also found that both methods mostly agree, see Appendix
Comparing researchers and protocols
All research is done on a train set (and optional validation set), then protocols and attackers are frozen. Final safety is reported using a test set so there isn’t any contamination from the iterations.
Comparing researchers
Blue teaming researchers: find the best protocol by iterating the protocol against an attacker they create on the train and validation sets. Then hand that fixed best protocol off to the red team, whose red teaming researchers find their best attack against it. The final safety is used to calculate the ELOs of the blue teaming researchers.
The reason why the blue teaming researcher goes first is that their goal is to create a protocol that is robust to many attacks (in production, it is unknown how it will be attacked), while the red teaming researcher assumes the attacker has knowledge of the protocol and just tries to do best against that protocol.
Red teaming researchers: similar to blue researchers. Fix a protocol (for example, found by the blue researchers); each red teaming researcher finds their best attack against it, and the final safety is used to calculate ELOs of the red teaming researchers.
Comparing protocols and attackers: When comparing protocols and attackers, we usually hold the researcher constant, and the researcher iterates both blue and red teams. Once they find their best protocol and the best attacker against that protocol, they freeze both and run on the test set.
The output is an ELO for each of the…

 点赞
点赞 收藏
收藏 点踩
点踩 分享
分享